Bulls’ pressure double in Sponge market
SPONGEUSDT Price Analysis – 03 August
As long as Sponge overcomes the $0.000136 resistance level and reaches the $0.000196 and $0.000330 barrier levels, the bulls may continue to dominate the market.
Key Levels:
Supply level: $0.000136, $0.000196, $0.000330
Demand level: $0.000093, $0.000006, $0.000004
SPONGEUSDT Long-term Trend: Bullish
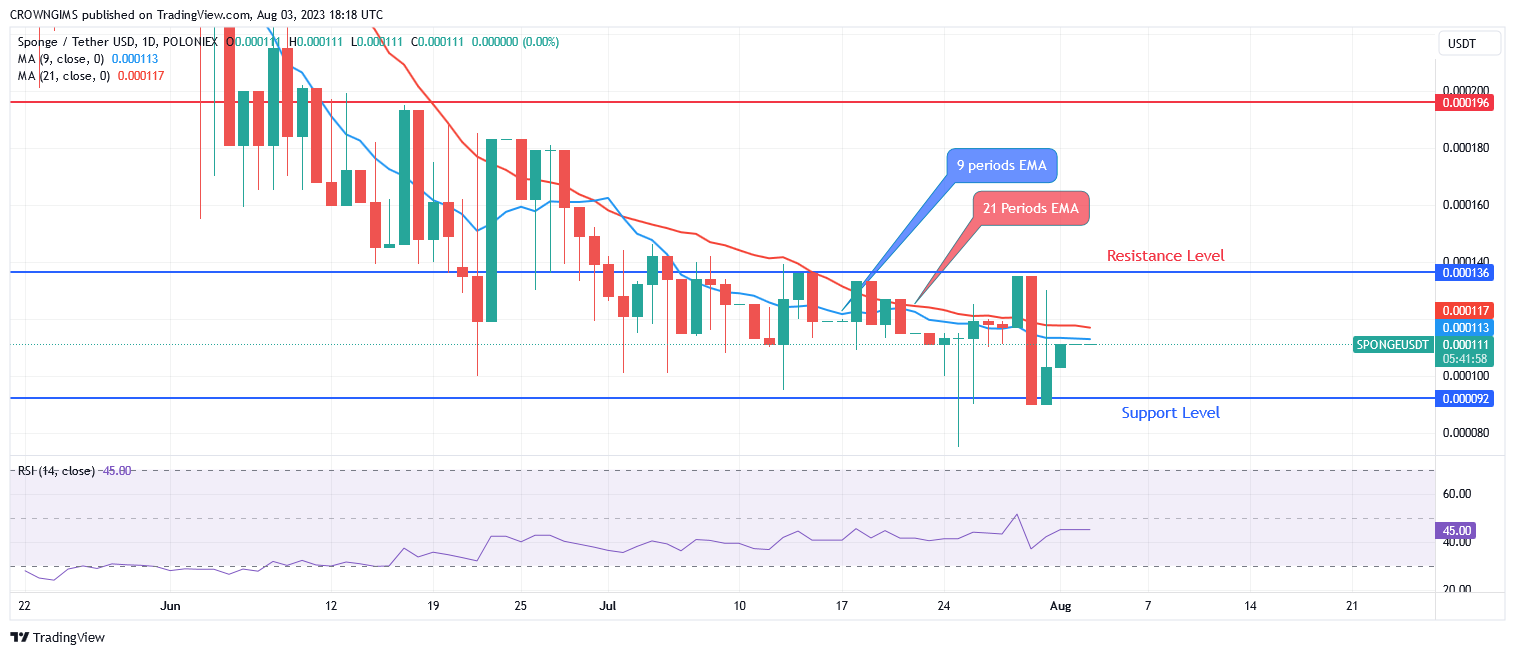
SPONGEUSDT is bullish on the daily chart. The bullish chart pattern that was created at the support level of $0.000093 is supporting the bulls. This is pushing the currency in a bullish, eagle-like trajectory toward the north. Sponge may surpass the $0.000136, $0.000196, and $0.000330 barrier levels of resistance before topping there.

After the collapse, buyers are coming back to the sponge market. The price is trading just above the two EMAs, which both show upward movement, and the rapid Moving Average (9 periods) is crossing the slow Moving Average (21 periods EMA) in that direction. As long as the price overcomes the $0.000136 resistance level and reaches the $0.000196 and $0.000330 barrier levels, the bulls may continue to dominate the market.
MORE LISTINGS FOR SPONGE COIN MEME token! Is this the upcoming major MEME COIN?
SPONGEUSDT medium-term Trend: Bullish
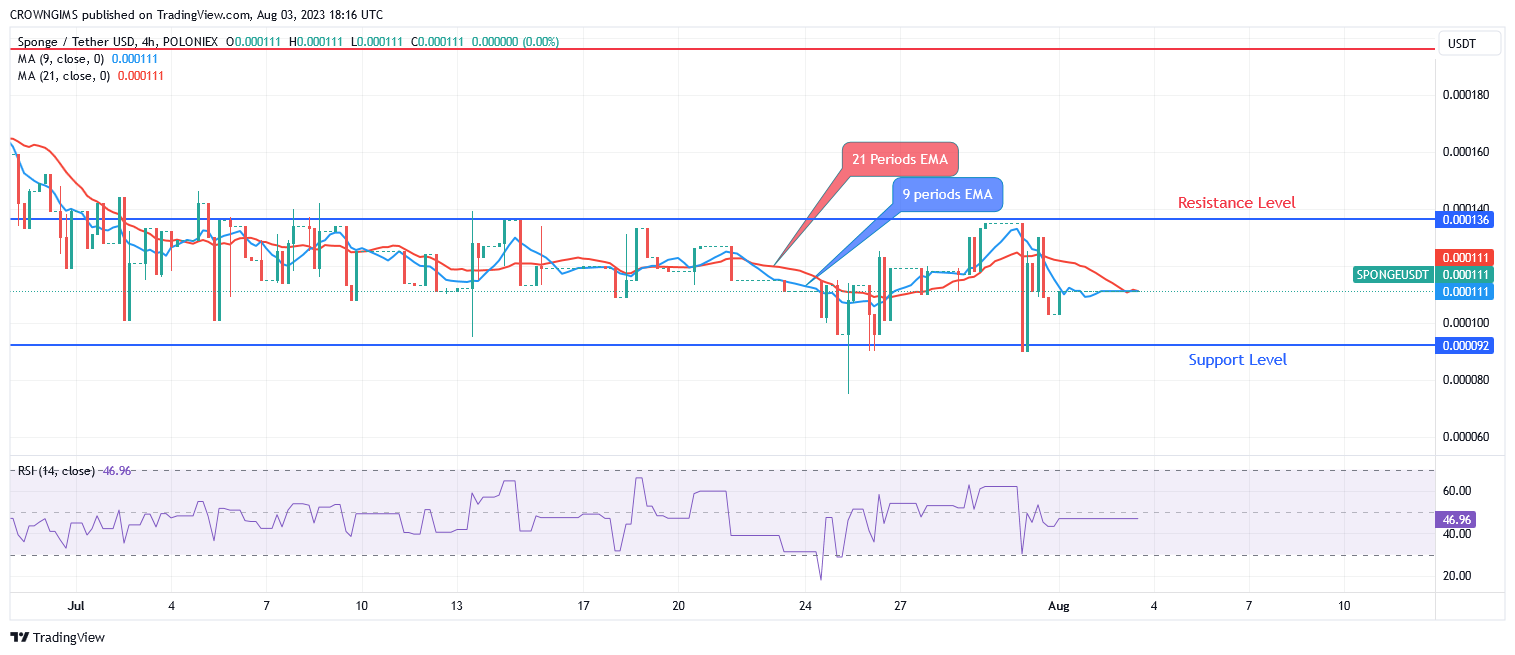
SPONGEUSDT is bullish in the 4-hour chart. The medium-term trend is still bullish as the bulls’ pressure gets progressively greater. The resistance level of $0.000136 is tested after the price bounces off the support level of $0.000093. The price is now increasing and holding steady at $0.000093.

The fact that the two EMAs are attempting to diverge indicates that the market has strong momentum. In the range between the 9-period and 21-period exponential moving averages, the currency pair is trading higher. The signal lines of the relative strength index period 14 are bending upward to display a buy signal at levels 46.
Invest in the hottest and best meme coin? Buy Sponge ($SPONGE) today!


Leave a Reply