A bullish trend began in Sponge market
SPONGE Price Analysis – 01 November
SPONGEUSDT will rise to $0.000196 and $0.000330 if the resistance level at $0.000136 is breached. The price may drop to the $0.000004 and $0.000006 support levels if the $0.000136 level holds and the $0.000087 level allows.
SPONGEUSDT Market
Key Levels:
Resistance levels: $0.000136, $0.000196, $0.000330
Support levels: $0.000087, $0.000004, $0.000006
SPONGEUSDT Long-term Trend: Bullish
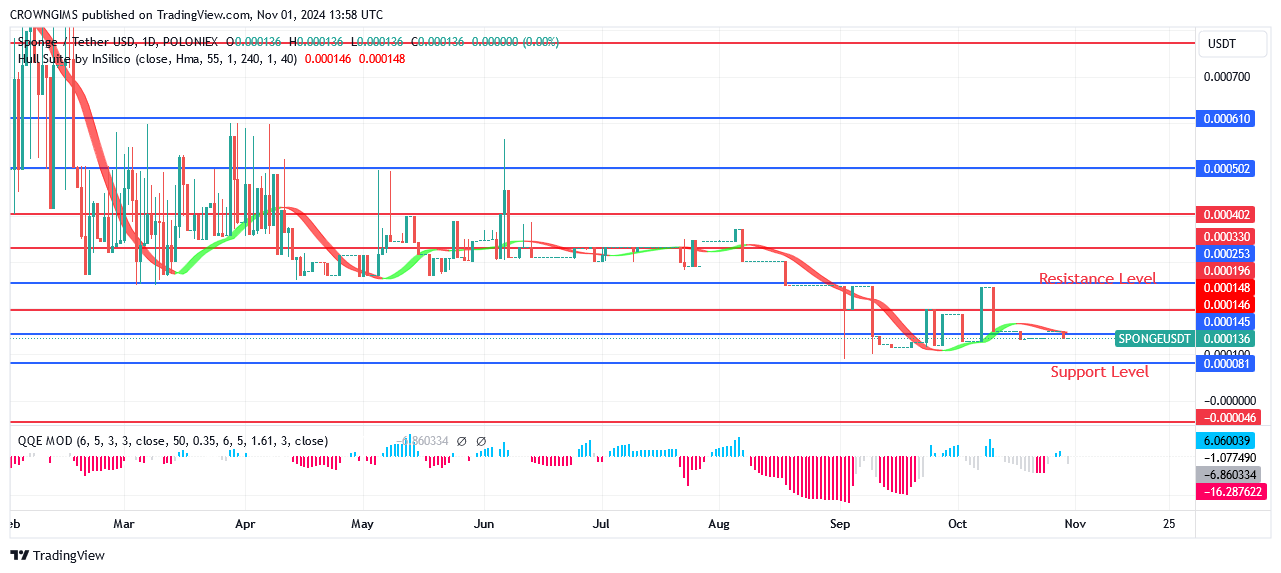
On August 7, after a few days of stabilization, Sponge started to increase. When the extended daily bullish candle emerges and breaches the $0.000136 resistance level, this becomes clear. With more bullish candles emerging, the price is getting closer to the $0.000196 price level. A strong daily bullish candle is building near the $0.000136 barrier level, where the sponge might rise this week.

The daily chart shows that buyers are in charge of the market. A bullish trend began when the price exceeded both of the Hull Suite crypto signaling indicators. The price will rise to $0.000196 and $0.000330 if the resistance level at $0.000136 is breached. The price may drop to the $0.000004 and $0.000006 support levels if the $0.000136 level holds and the $0.000087 level allows. In the meantime, the QQE MOD indicator, whose histogram is above the zero line, provides a useful hint.
SPONGE V1 MISSED: DO NOT MISS V2! Sponge V2’s Potential Is 100X
SPONGEUSDT Medium-term Trend: Bullish
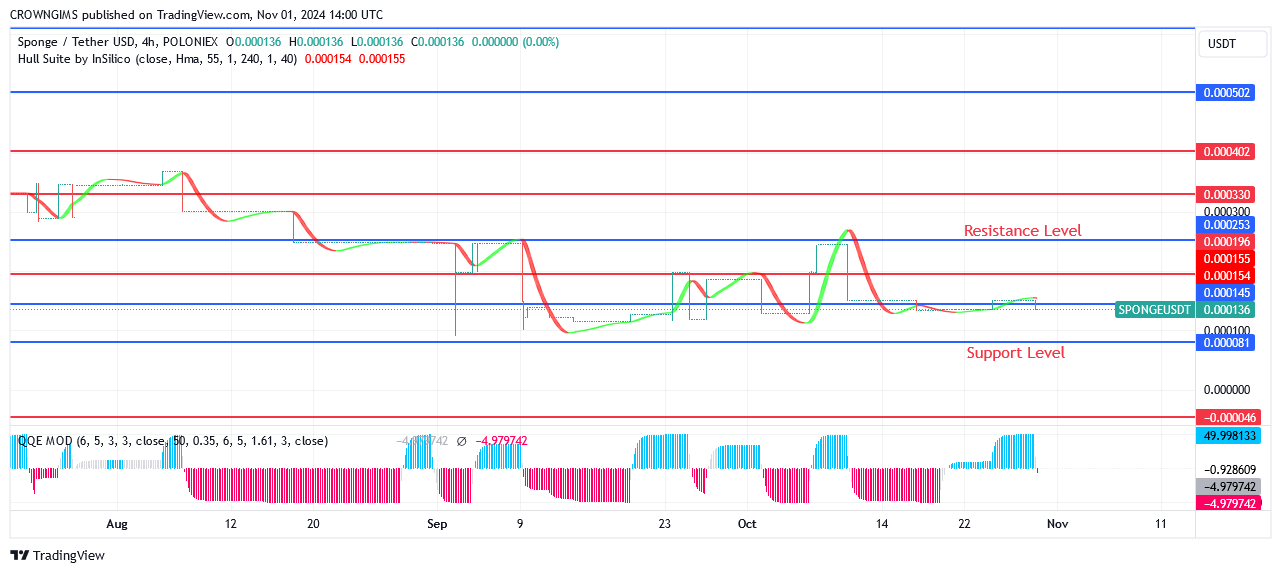
The steady expectations of its clients may be the reason for Sponge’s exceptional performance throughout the medium term. In other words, price actions have been upward since the $0.000087 price level was tested. Unless the bulls provide a solid barrier or the resistance level of $0.000136 holds, the market might keep rising.

The upward surge may aim for the crucial resistance levels of $0.000136 and $0.000330. With one more push from the bulls, the coin might reach the high resistance level of $0.000330. The QQE MOD indicator’s rising signal line indicates a purchase signal.


Leave a Reply