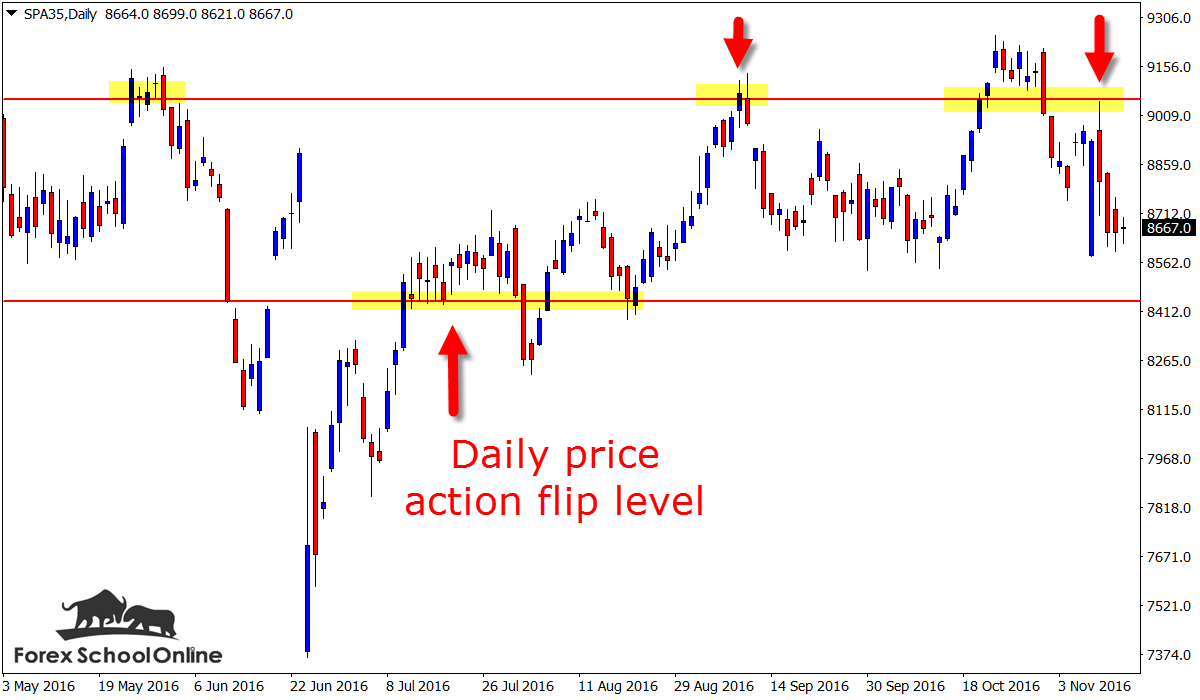
Price on the SPA35 daily chart is pondering it’s next move after rejecting the major daily resistance level and selling off lower with a strong rejection.
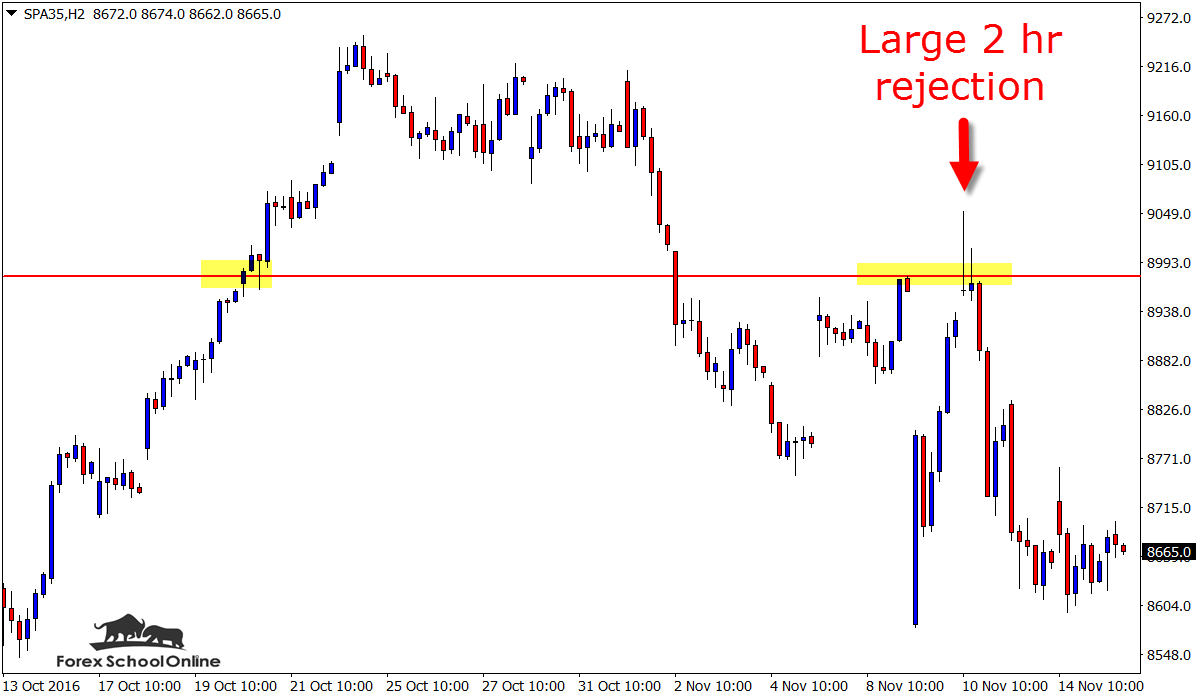
Just below I have attached for you both the daily and 2 hour price action charts. On the 2 hour chart you can see this strong and aggressive sell off that occurred in it’s clearest.
Price attempted to make a fresh break back higher up and through the daily resistance level that has also been a long-term major daily range high. As you can see on the 2 hour chart below; price tried to break through this level and it did move up and through for a period of time.
Price popped higher and through before a ton of bears / sellers came flooding back into the market and price snapped back lower and this created a false break. This is how ‘False Breaks’ are created for both bearish and bullish setups.
I go through and discuss this in more depth in the live daily trade setup at; Daily False Break Live Video Setup
Price on the SPA35 is in a very sideways and ranging type period and has been for quite some time. This is always something we need to take into account when we look at the price action story as a whole. When we are looking to make a trade and look at our pre-trade plan to manage our trade, looking at the market type is crucial.
I know a lot of you will be wondering about the 2 hour charts below, and how you can create them for yourself on your own MT4 charts. This is super easy to do and by using a simple indicator you can create any time frame you like from the 1 minute chart upwards.
If you want to get this indicator and learn how to use it, then you can get it at;
Change MT4 Time Frame EA Indicator
Price on this index is now stuck within this tight range and consolidation period, however if it can break lower the near term support comes in around the 8442.40 area.
With a market such as this we need to keep our eyes peeled to all the minor levels within the boxing and tight ranging areas.
Daily SPA35 Chart

2 Hour SPA35 Chart


Leave a Reply