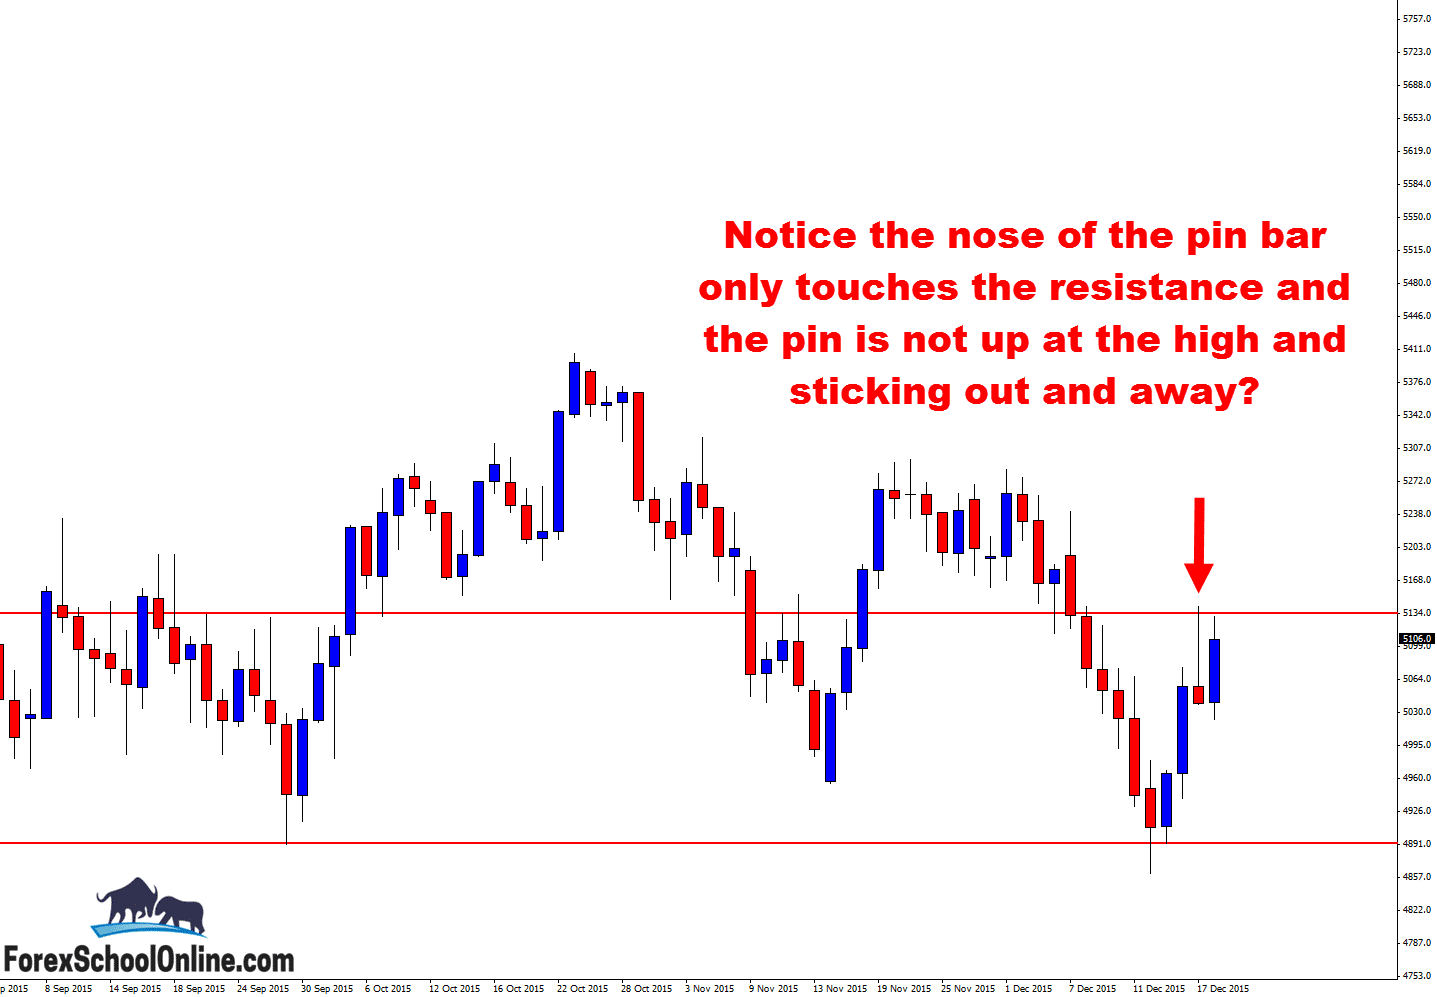
The S&P200, or the ASX200, the major Australian stock index, has formed a sucker pin bar on the daily chart that would have tempted and, ultimately, tricked a lot of traders into playing. The pin bar in question was at a resistance level, and that’s why it would have looked too tempting and so tricky.
I discussed this market just the other day in my daily market commentary where I posted ASX200 Fires Off False Break Pin Bar Reversal | 17th Dec 2015. Price had formed a large 3 day pin bar reversal that was making a false break of the support level. In the post, I looked at the major resistance that price was looking to move into overhead.
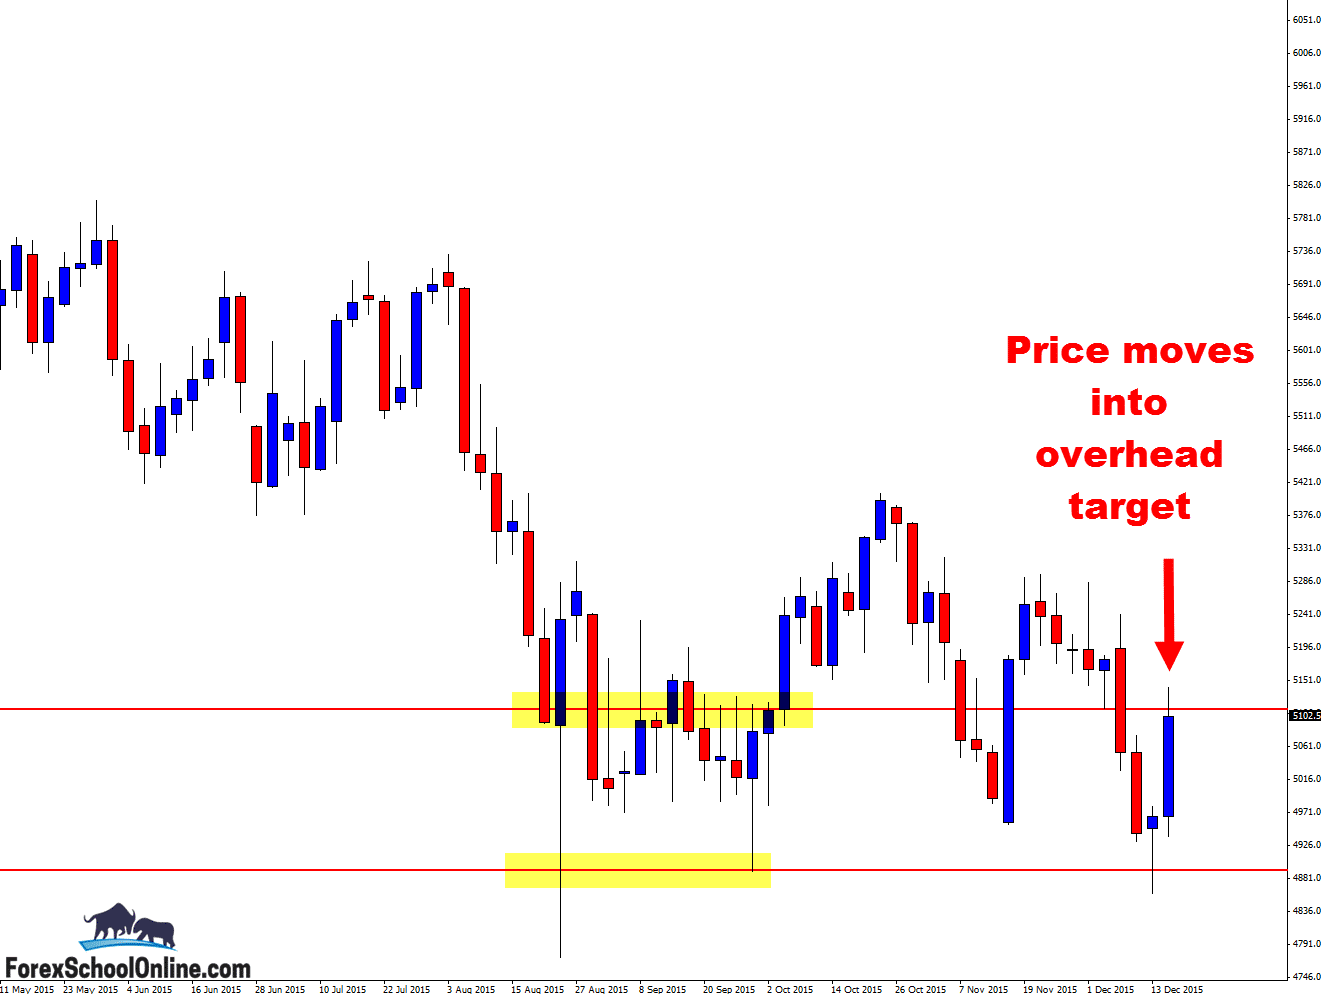
Since that post, price has now ripped higher in an aggressive fashion and moved strongly into the resistance level as you can see on the daily and 3 day charts below. The resistance level is a fairly solid level to look for short trades and, as I am about to cover, if this same pin bar had formed slightly differently, then I would have taken it at the exact same level. So, the level is not the issue.
Price is in a sideways and clear range movement in this market. That means a few things. It means that levels are more important than ever and price is a lot more likely to respect minor levels than if it was trading in a strong and obvious trend. Why is this important?
If we look back to the left we can see a whole heap of matching candle lows. If we are to enter this pin bar, we would be entering into a whole area of support. If price can break this level and move lower, then there is space and room to move lower. But, this level would need to break first.
The other major concern is where this pin bar is formed. It is down low and just touching the resistance level with the nose of the pin bar. This is a concern. What we would need to see is price right up and sticking out and through. This way, a lot of bears or sellers would be getting activated for price to sell back lower. The other thing it would do is create space for you to make a short trade.
Instead of making an entry where you are now into the support area, you would be making an entry up much higher which would give you space to work with which would be much higher probability.
Daily Chart – Sucker Pin Bar

Daily Chart – Key Level
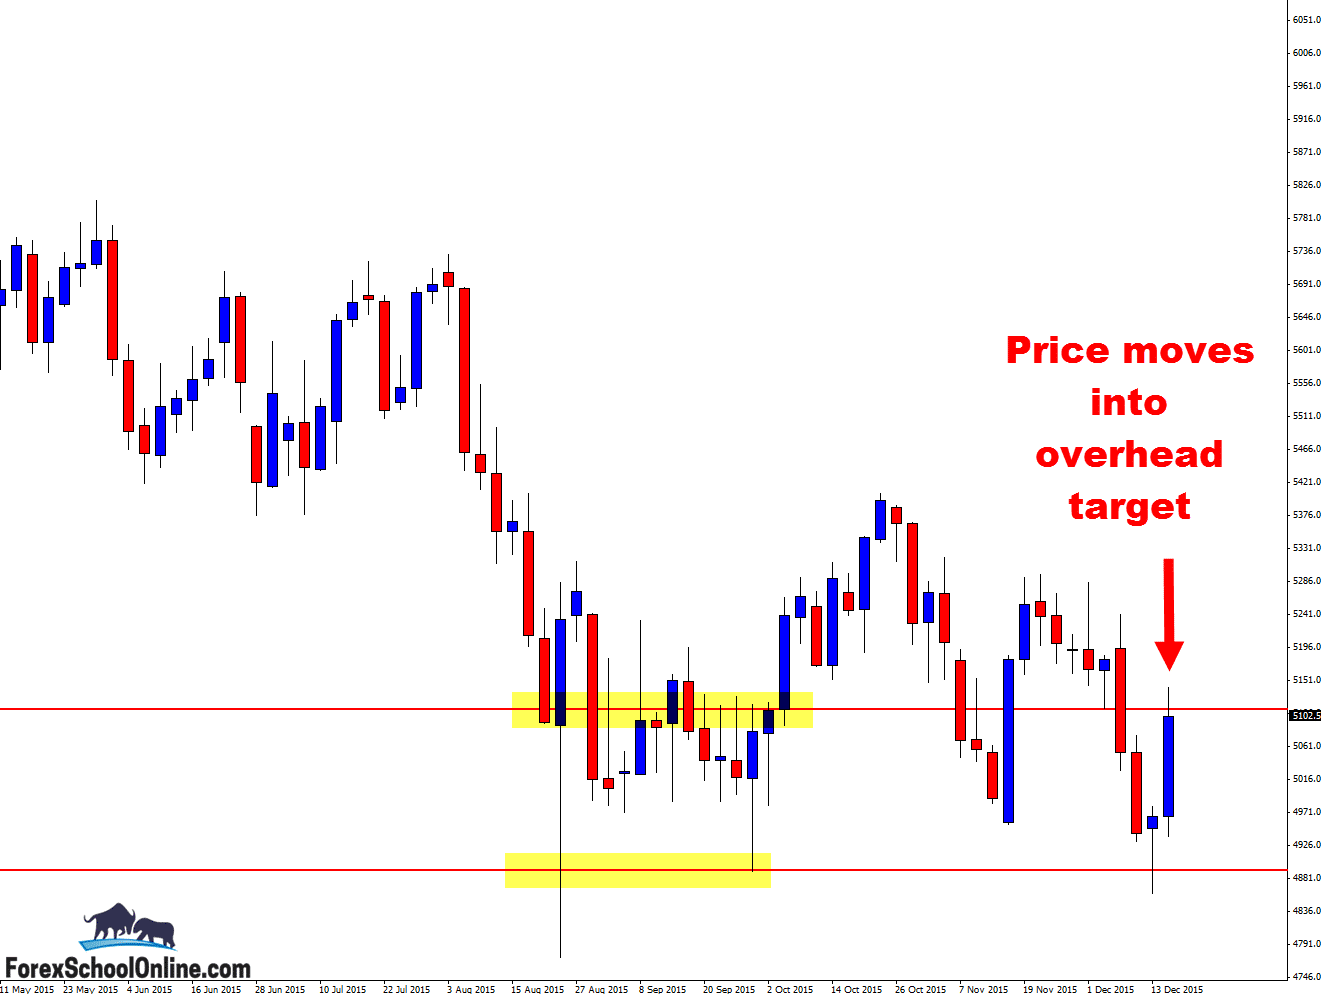
3 Day Chart – Profit Target Reached


Leave a Reply