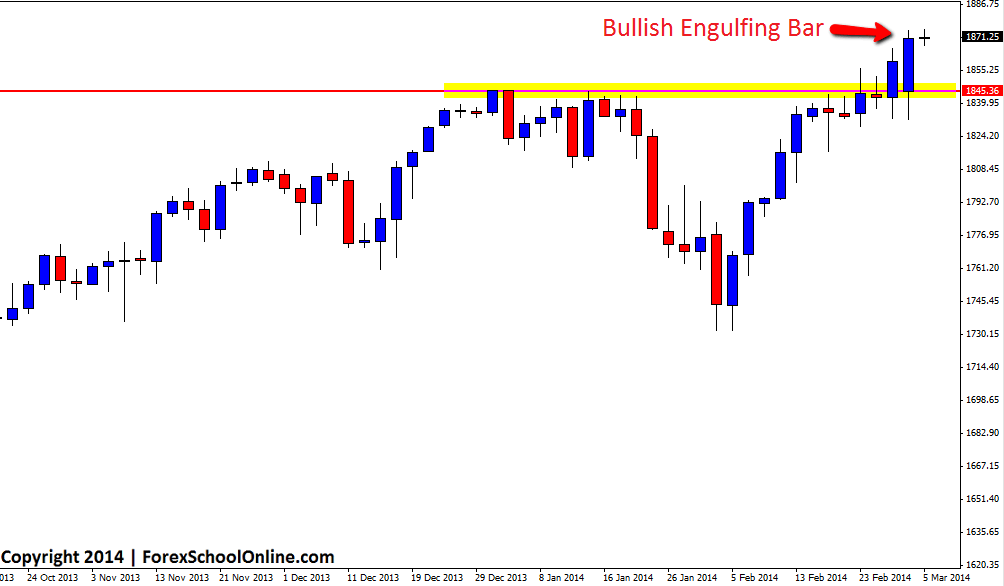
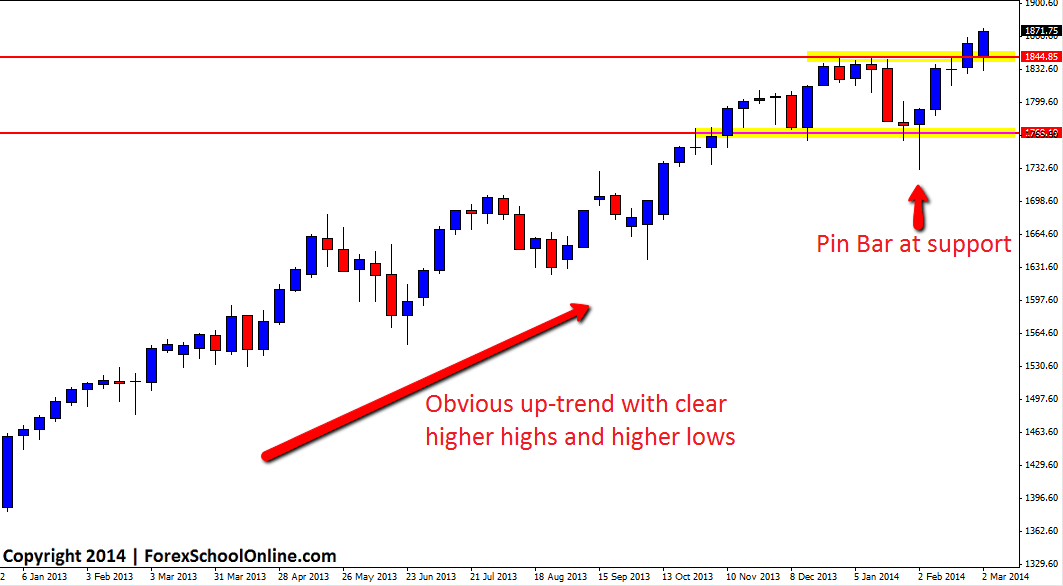
The S+P 500 has printed a Bullish Engulfing Bar (BUEB) that has pushed price higher and into all time highs on the two day price action chart. Price has been making a series of all time highs this year with price in a sustained up-trend making higher highs and higher lows. This recent leg higher was kicked off by a quality bullish pin bar reversal on the weekly chart that was down at the low and rejecting support.
This chart this year has been one of the cleanest up-trends for traders to play and these types of clear and obvious trends are the types of markets that all traders should be targeting for trades and especially newer traders. Trades in trends cannot be just played from anywhere however and for high probability trades to be made they need to be played from value areas when price pulls back into value. You can learn about how this is done in a trading lesson here: How to Trade Price Action in Trending Markets.
From here traders should look to keep trading the same way until price action dictates otherwise. When price rotates back into value, traders can then either stay on the same time-frame or move to smaller time-frames such as the 4hr and 8hr to look for high probability price action setups such as the ones taught in the Forex School Online Members Courses.
If you want to be able to change your MT4 charts so that you can make them any time frame you want like the 2 day chart below, see this article here: Changing MT4 Chart TimeFrames
S+P 500 2 Day Chart

S+P 500 Weekly Chart

Related Forex Trading Articles & Videos
– The Real Reason Forex Traders Fail | Think and Act Like a Pro


Leave a Reply