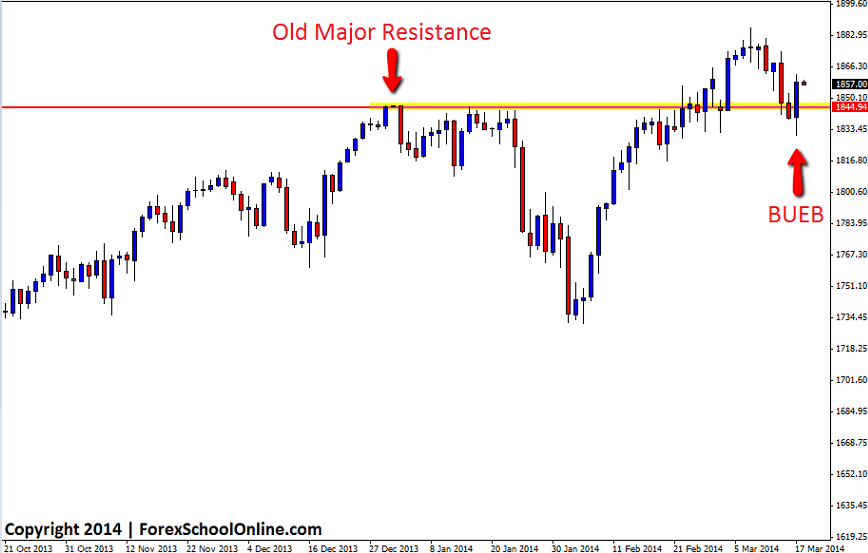
Price on the daily S+P 500 chart has fired off a large Bullish Engulfing Bar (BUEB) on the daily price action chart. The S+P 500 is a nindex that is made up of 500 US stocks that are picked based on their size, liquidity and the industry they are operate in, among other factors. The S+P 500 is a very popular benchmark for the overall US stock market and similar in operation to the Dow Jones which is why the two will often move in similar ways. Traders will note that the Dow Jones 30 has also formed a Bullish Engulfing Bar on it’s daily chart today, similar to the S+P 500’s chart. The Dow Jones however only has 30 companies and this is why the S+P 500 with 500 stocks gives a much better indication of the overall US stock market.
The BUEB that fired off on the daily price action chart has fired off at a key support level. This support level has acted as a major resistance in the past with price having great difficulty trying to break through, before then going onto to bust through and make all time highs when it did. Now that price has moved lower into this key support area, price has tested it and held to form the bullish engulfing bar, showing that at this stage price is rejecting the support level.
The short term and longer term trends are higher so if price can break and confirm the engulfing bar by breaking the high, it would not then surprise to see price move into the recent swing highs. If price fails and moves back lower, the support level just discussed will be the first level price will have to contend with if it tries to make any moves lower.
S+P 500 Daily Chart

Related Forex Trading Articles & Videos
– Live Engulfing Bar Trade on EURUSD *Video*
– Transforming Your Forex Trading With a Profitable Trading Edge


Leave a Reply