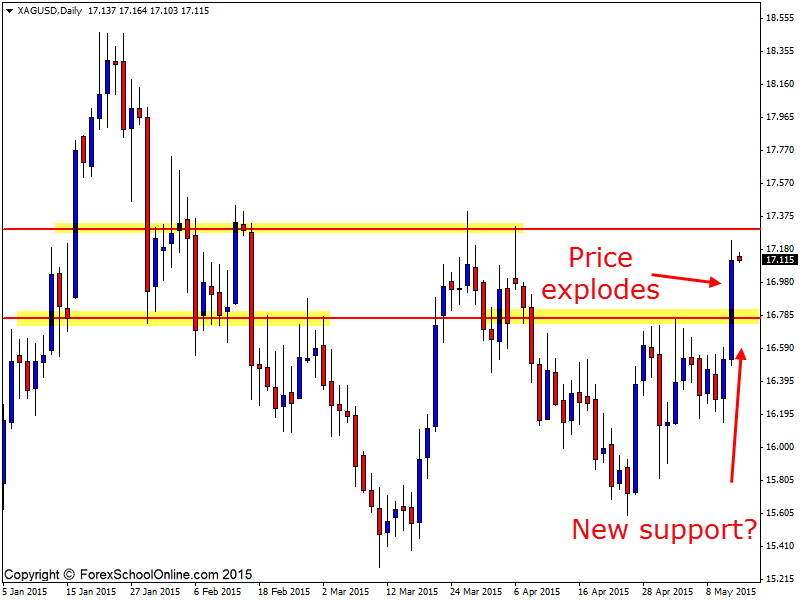
The Silver v USD or XAGUSD has smashed higher crashing through a major daily resistance level to importantly close above a level that had been containing price for the last three weeks. This resistance level has been a major price flip level for some time.
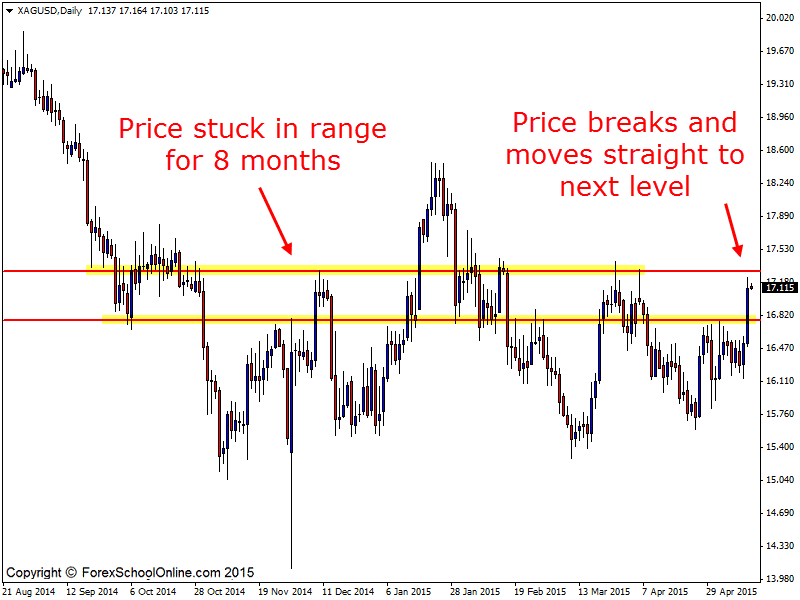
As the daily chart shows below on both the zoomed out and zoomed in charts; price over the last eight months has really battled with this level as both a support and resistance level.
Because of this sideways move over the last eight months there has been no clear trend in either direction. Price has just been bopping up and down and wrestling with the daily levels. Whilst these markets that are in ranges and sideways moves can be the most tricky to play, as long as they have major levels and space to be traded into so you can manage them effectively, they can still safely be navigated and traded.
With price now making a strong break higher and moving straight into the next resistance overhead, intraday traders who like to look for setups on charts such as their 8/6/4/2/1 hour charts could look for price to make a pull-back into the same area price exploded out of.
The old daily resistance area could become a new support area and act as a new price flip. Traders could take advantage of this by watching the price action behavior to see if any bullish price action clues or price action signals present to get long.
Silver Daily Chart Zoomed In

Silver Daily Chart Zoomed Out

Related Forex Trading Education
– How BADLY do You Really Want to Become a Successful Trader?


Leave a Reply