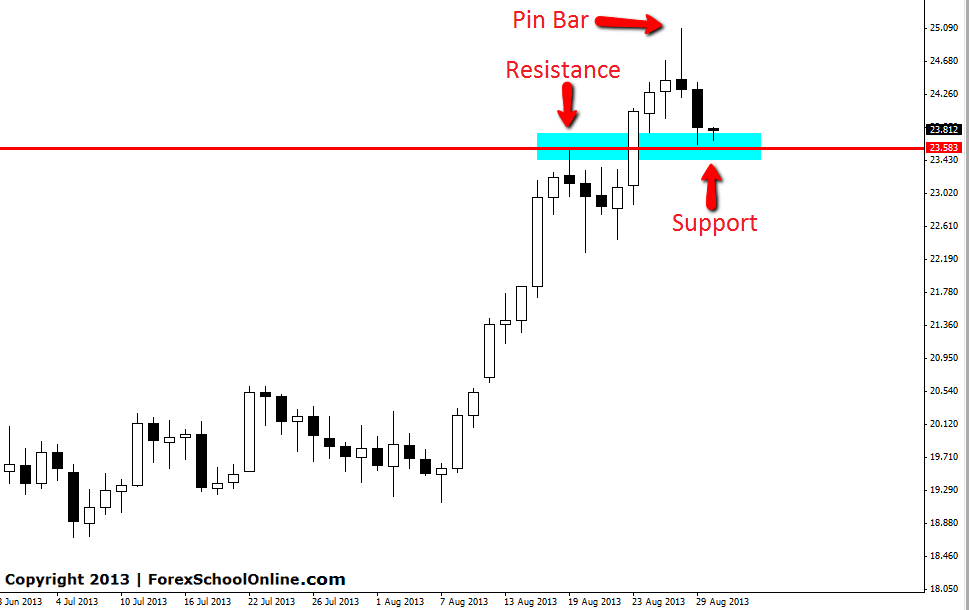
Silver has moved lower and into a key daily support zone on the daily chart. This move lower came after the daily chart fired off a bearish Pin Bar at resistance. This pin bar was discussed in this blog yesterday and you can read that post HERE. Once price broke the low of the pin bar it moved lower and into the key support zone.
This key support zone has previously acted as an old resistance area and has now flipped. As I write this blog post price is testing this support. Price on the daily chart is an up-trend and making higher highs and higher lows.
Trend traders could start looking for long trades with the trend at this key level if bullish price action is produced. If price breaks through this level and no bullish price action is produced traders can keep an eye on this level to see if it continues to act as a key price flip zone.
SILVER DAILY CHART


thanks man
thank you Fox.
Thanks Johnathon