On Tuesday I made a “Charts in Focus” commentary about the 3 x GBP pairs that were all at the time testing major resistance levels. These pairs were the GBPAUD, GBPSGD and the GBPCAD.
Of these Forex pairs the GBPAUD has broken through higher and moved into the next resistance overhead, the GBPSGD is still testing the same level and has since formed an inside bar and the GBPCAD has formed a rejection on the smaller intraday timeframes and moved a little lower which is what we are going to look a little closer at today.
GBPCAD Daily & 6 Hour Chart
As I posted and discussed the other day in the first post on this pair; of the three, the GBPCAD was the highest probability to roll back lower and make a reversal and that is what the price action story was showing us at the time.
Read Tuesday’s commentary here; 3 x GBP’s Forex Pairs Sitting at CRUCIAL Daily Price Action Levels | 26th April 2016
All three GBP pairs were making strong reversals higher after huge legs lower and they had all formed a base down at the support lows of some sort, however; there were differences.
The GBPSGD had reversed back higher off the lows. It then paused and started to wind up with inside bars before making another move higher or in other words was beginning to build momentum higher.
The GBPAUD had formed a large Bullish Engulfing Bar = BUEB, engulfing two previous candles down at the low and then forming large and commanding bullish candles to move higher.
Out of the three GBP pairs that were all quite similar, the GBPCAD formed the most shallow pull-back or rotation into the resistance, meaning that whilst the move lower has been huge over the previous months, price could only manage a pull-back higher of a few days.
That meant that price could be a chance to move back lower with the recent strong trend and momentum, even if only for a while on the intraday charts.
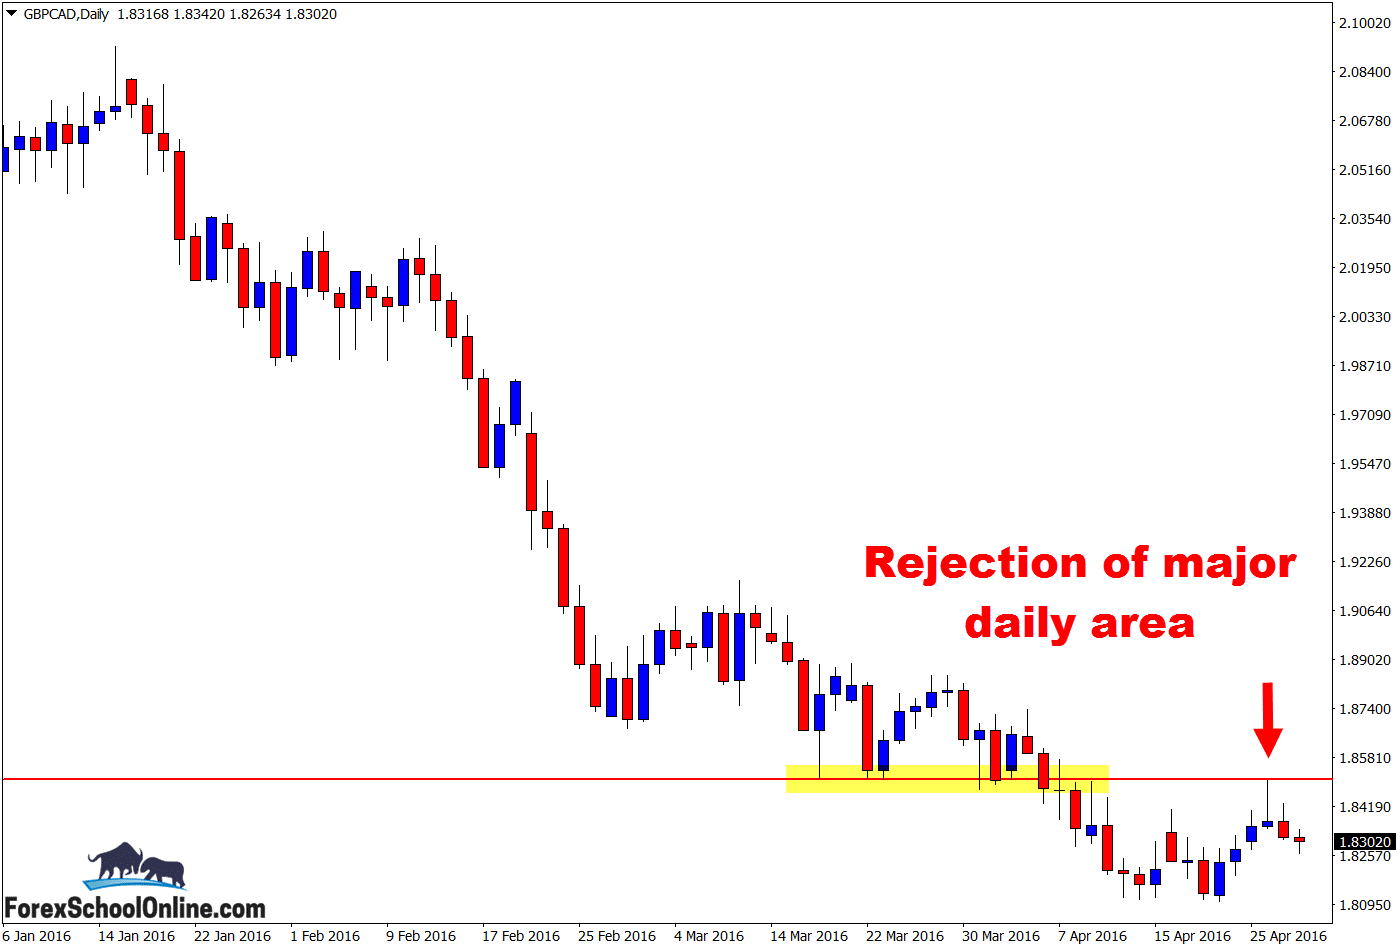
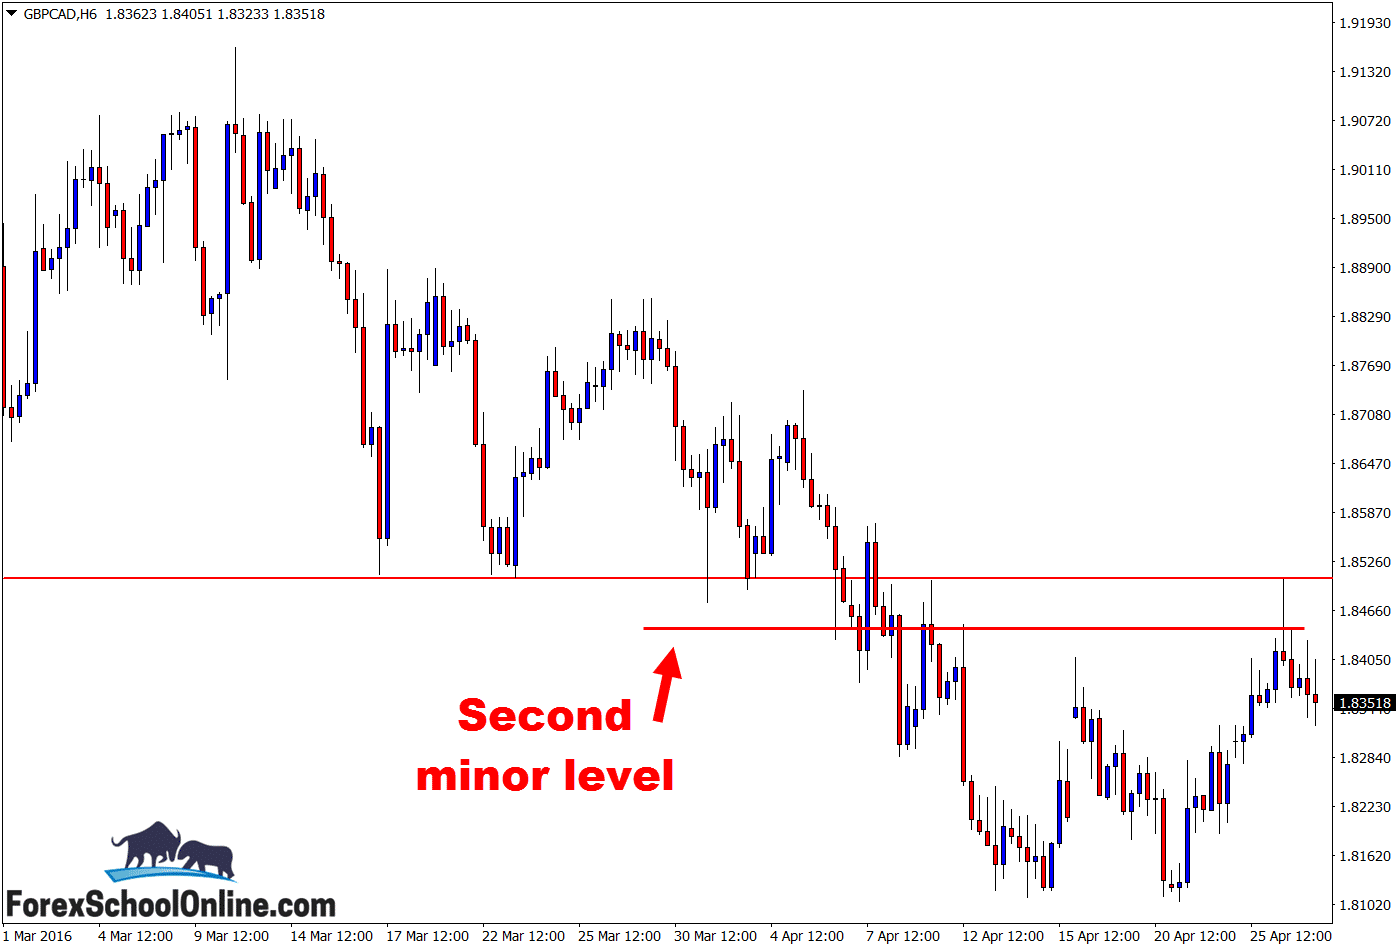
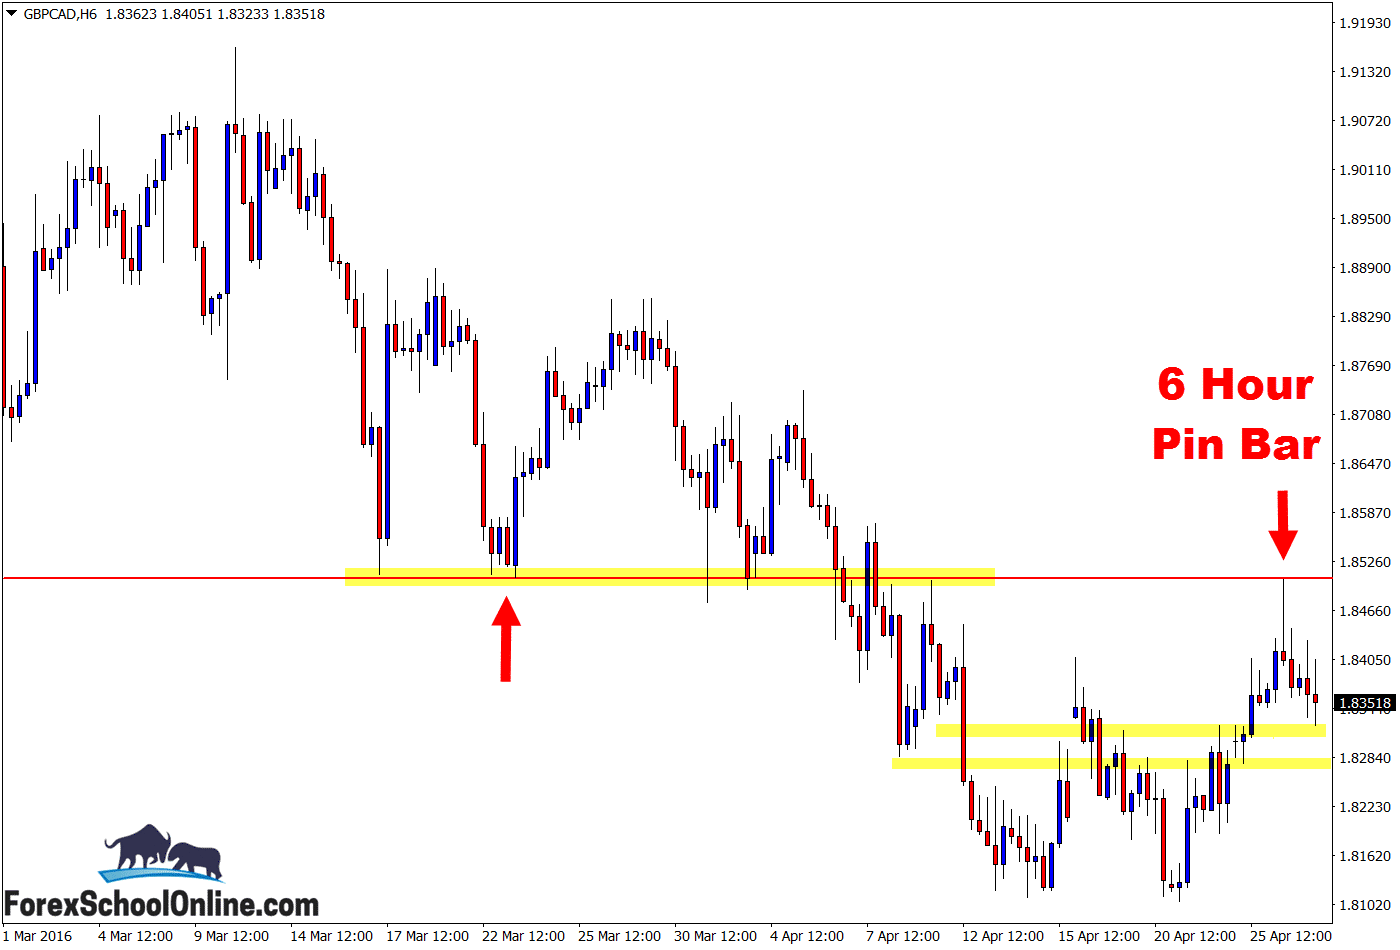
Price formed a 6 hour pin bar at the daily resistance. This was a solid setup and it allowed for a trader to get into the short setup and have a path to manage their trade into the next support level that price has now moved into.
This could have been an even better pin bar if price formed right up at the high with the nose of the pin bar sticking out of the daily resistance level.
That would have created more space for the trader to trade into and meant that it had a higher risk reward potential. It would also mean that it had a little more safety because the trader could use the major daily resistance level in their favor with their stops a bit more, but what we are doing is not perfect and perfect trades do not exist, only high probability ones and trades that meet out trading edge.
If you want to know how to make a 6 hour chart on your MT4 platform like my chart below or any other time frame, then read this lesson at; Make Any Time Frame on Your MT4 Charts
Daily Chart – Daily Resistance

6 hour Chart – Pin Bar Reversal
6 hour Chart – Pin Bar Rejection

Related Forex Trading Education


Hi Rd,
you can read about Kill Zone Trading in this lesson https://www.forexschoolonline.com//trade-forex-like-a-sniper-and-start-trading-from-kill-zones/
Johnathon
This is the best site I’ve seen about this trading style. Very simplistic yet powerful and clear illustrations.
My question is do some call this type of trading “Kill Zone” trading? Are these places where the major banks move money from?
Why is it called “Kill Zone” trading? Is Kill Zone trading the same thing that you teach?