• Skip to primary navigation
  • Skip to main content
  • Skip to primary sidebar
  • Skip to footer

ForexSchoolOnline.com

Learn to Trade Forex Online

  • Compare Brokers
    • Broker Type
      • Paypal Brokers
      • Swap-Free Brokers
      • Low Spread Brokers
      • ECN / STP Brokers
      • Market Maker Brokers
      • Non Dealing Desk Brokers
      • Low Minimum Deposit Brokers
    • Country
      • Brokers for Australia
      • Brokers for South Africa
      • Brokers for the UK
      • Brokers for the US
      • Brokers for Nigeria
    • Regulation
      • FCA Regulated Brokers
      • ASIC Regulated Brokers
      • FSCA Regulated Brokers
      • CFTC Regulated Brokers
    • Platform
      • MT4 Brokers
      • MT5 Forex Brokers
    • Strategies
      • Hedging Forex Brokers
      • Scalping Forex Brokers
      • Carry Trade Forex Brokers
      • Brokers for Indicators and EA’s
  • Start Here
    • Start Trading Guide
    • Beginner Trading Lessons
  • Free Forex Course
    • Public Login
    • Register
    • Password recovery
  • Lessons
    • Strategies
    • Videos
    • MT4 Guides
    • Money Management
  • Trade Setups
  • Tools
    • Correct Free Demo Charts
    • Forex Journal Download
    • Position Size Calculator
    • FULL List of Tools
    • Forex Demo Accounts
  • Price Action Guide
  • Free Course

Reading the USDCHF ‘Live’ Price Action Story | 29 May 2015

Johnathon Fox
05/29/2015 | UPDATED ON: 08/06/2019

After covering a bunch of the major Forex pairs on my 27th May 2015 Daily Forex Trade Setups Commentary, today I want to look closely at and go over exactly how you can analyse the live price action on any chart to read the full price action story.

Whilst there is a heck of a lot more than what I am about to cover in this short post, what I want to emphasize in today’s post is that the price action and the area that you hunt your setups is KING, not the last one or two candles you use to enter the trade.

The trigger signals you use as your entry confirmation are also very important and they must meet a certain criteria, but before you even come to looking for the trigger signals you need to make sure that you have a really high probability area mapped out. All good price action trades are built off really great areas and where you are entering the trade on the chart.

The reason for this is simple and you can think of it like this; when you are entering from great spots on the chart and you are entering from really great areas of either high supply/demand you are putting yourself on the right side of the market when the banks and other big guys are making their moves.

Alternatively, when you do the opposite you are going to be entering when the big guys are just leaving and this is why we concentrate on the AREA first and foremost and then on finding the best trigger signals at the killer areas. To read about exactly how you can do this, the time frames and the routine you should be using, please see here;

The Ultimate Guide to Support and Resistance

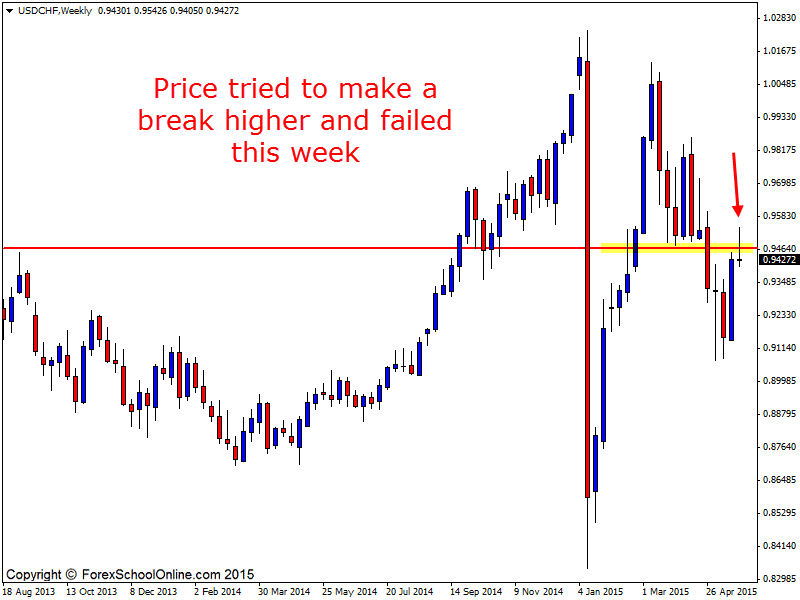
Below you can see the USDCHF weekly, daily and 1 hour charts. The weekly chart shows something pretty important this week in that it has tried to make a move higher and through the major resistance level. This is important information. We can see and know that at this stage the resistance level is holding strong and the bears are still in play.

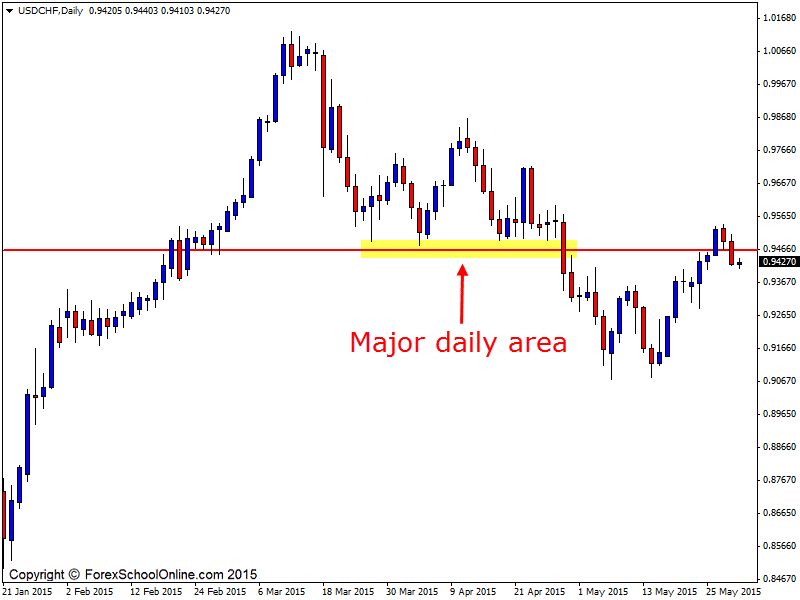
Price had made a strong move higher on the daily chart. If you look at the daily chart you will see it made a double low where price tested the same support level twice just recently before making the most recent run higher. This run higher was strong and looking to burst straight through the resistance, but price is back below and once again at this stage the level remains valid and intact.

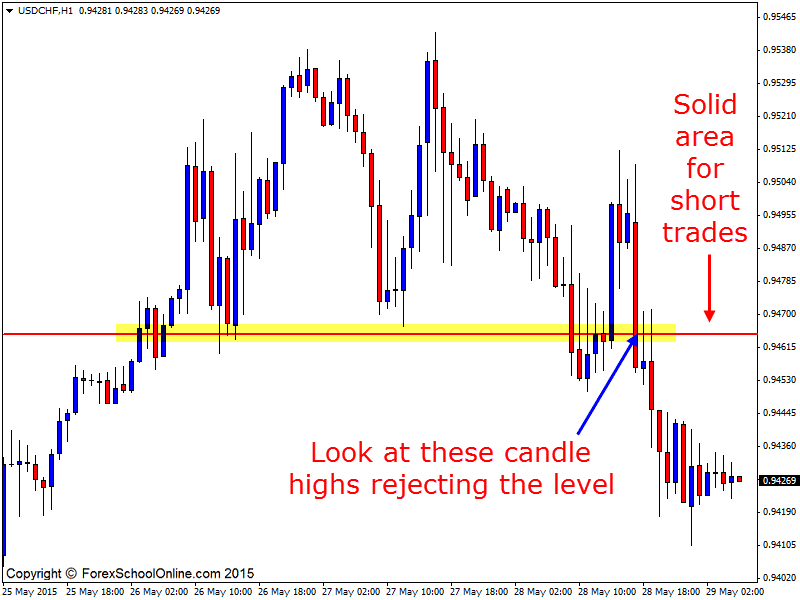
The intraday 1 hour chart really tells us a story. This is where we can see how strong this level is and this is often the case. You will notice on the chart below that I have marked it to highlight it for you. Once price broke through and lower below the major support, price made a quick retrace on the 1 hour chart to test the resistance level. Notice the two candle highs rejecting the level exactly.

If price makes another quick retrace back higher, this level would once again be a very solid level to watch the price action for potential short trades.

These are the types of levels on other charts, not just Forex that you can learn to hunt on both the daily and intraday charts to make very high probability setups. Obviously there is a lot more that does go into it, but always make sure you keep firmly in your mind that the price action area is the KING.


WEEKLY CHART

USDCHF WEEKLY CHART


DAILY CHART

USDCHF DAILY CHART


1 HOUR CHART

1USDCHFH1

Related Forex Trading Education

– The Forex Trading Signals to Avoid

Recommended Broker

  • Broker
  • Min Deposit
  • Benefits
  • Score
  • Visit Broker

$200

T&Cs Apply
  • The Lowest Trading Costs
  • 50% Welcome Bonus
  • Award-winning 24 Hour Support
5
Trade Now FreeBets Reviews
Reviews

About Johnathon Fox

Johnathon is a Forex and Futures trader with over ten years trading experience who also acts as a mentor and coach to thousands and has written for some of the biggest finance and trading sites in the world.

View all posts by Johnathon Fox →
Previous Post: « EURUSD, USDJPY & USDCAD Price Action Catches Fire! | 27th May 2015
Next Post: Aussie 200 Rotating Back Into Value Intraday Hot Spot | 9th June 2015 »

Reader Interactions

Comments

  1. Gary says

    06/03/2015 at 1:14 PM

    Thanks for the insights.

    I actually drew my S/R line a little higher than yours in the Daily chart, and when I look at my H1 chart, it seems that the my line is much higher than yours, such that all the price seems like they have not reach my price action area.

    May I ask, when we want to see rejection of the price action area, do we have to really see the PB/EB/2BR passes through the S/R lines we drew,, or as long as they are close enough we can say that they are rejecting the area?

    Reply
    • Johnathon Fox says

      06/10/2015 at 12:44 PM

      Hi Gary,

      it depends on what we are looking for and in what scenario or situation….

      For example; if we get a pin in a range that just touches a level and not really push up and into it, then this could be a real concern.

      Think of it this way; when price such as a pin bar moves up and then snaps back from an area it is activating a bunch of either buyers or sellers depending on whether it is coming from higher or lower and so when we see the reversal signal reject right up and into an area it is a really good thing.

      Safe trading,

      Johnathon

      Reply

Leave a Reply Cancel reply

Your email address will not be published. Required fields are marked *

Primary Sidebar

Forex School Online

High Probability Price Action Trading

How to make, manage and take profit from trades in the markets

Start Learning (It's Free!)

Turn Your Trades into Winners!

The Price action course is the in-depth advanced training on assessing, making and managing high probability price action trades.

Sign up for Free!

Recommended Broker

  • Broker
  • Min Deposit
  • Benefits
  • Score
  • Visit Broker

$200

T&Cs Apply
  • The Lowest Trading Costs
  • 50% Welcome Bonus
  • Award-winning 24 Hour Support
5
Trade Now FreeBets Reviews
Reviews

Footer

Get Our FREE Course, Bonus Strategies & Indicators!
X
Join Us Now!

Your capital is at risk.

X

CORNERSTONE LESSONS

Forex Trading for Beginners

Price Action Trading

How to Trade Forex

Technical Analysis

Forex Charts

Forex Trading Strategies

Money Management 

Compare Brokers

Best Forex Brokers

Forex Demo Accounts

Best Forex Trading Platforms

Forex Apps

Swap Fee Accounts

MT4 Brokers

CATEGORIES

Forex Videos

Trading Lessons

Weekly Trade Ideas

Start Here Guide

ForexSchoolOnline.com helps individual traders learn how to trade the Forex market

WARNING: The content on this site should not be considered investment advice and we are not authorised to provide investment advice. Nothing on this website is an endorsement or recommendation of a particular trading strategy or investment decision. The information on this website is general in nature so you must consider the information in light of your objectives, financial situation and needs.

Investing is speculative. When investing your capital is at risk. This site is not intended for use in jurisdictions in which the trading or investments described are prohibited and should only be used by such persons and in such ways as are legally permitted. Your investment may not qualify for investor protection in your country or state of residence, so please conduct your own due diligence or obtain advice where necessary. This website is free for you to use but we may receive a commission from the companies we feature on this site.

We Introduce people to the world of currency trading. and provide educational content to help them learn how to become profitable traders. we're also a community of traders that support each other on our daily trading journey

Forexschoolonline.com is not a financial advisor. Do your research before investing your funds in any financial asset or presented product or event. We are not responsible for your investing results.

Copyright © Forex School Online Sitemap  - Privacy Policy - Disclaimers & Terms of Use - CONTACT US