Quant Price Forecast: October 29
QNTUSD price is likely to face the positive direction and break above the $235.000 previous high mark if the current support at $168.107 value holds. The $400.000 supply trend line may be the target.
Key Levels:
Resistance Levels: $235.200, $235.300, $235.400
Support Levels: $168.200, $168.100, $168.000 QNTUSD Long-term Trend: Bullish (Daily chart)
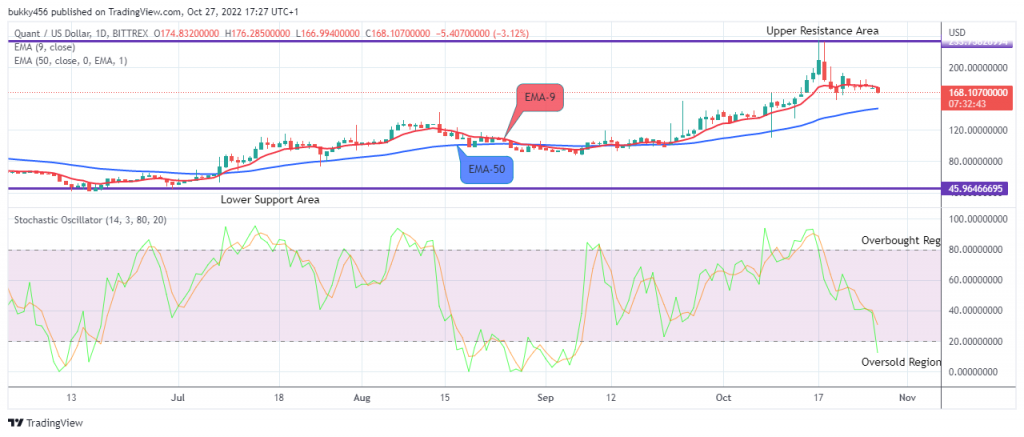
Despite the interference of short-term traders in the price flow, the long-term market of Quant shows a bullish race. The moving averages have already widened their gap, indicating that the bulls are still on top.
The coin price found support at a $168.107 value above the EMA-50 but below the EMA-9 as the daily chart opens today. This implies that the buyers are still in control of the market and in that case, it’s in a bullish trend. However, with this trend, traders may buy the coin at a low price and move the market higher.
However, the market has reached the oversold region of the daily stochastic, therefore there is a possibility of a rise in the price of the QNTUSD pair soon. If this is achieved, the bullish phase may touch the $400.000 upper high mark and beyond.
QNTUSD Medium-term Trend: Bearish (4H chart) QNTUSD to Retrace Soon
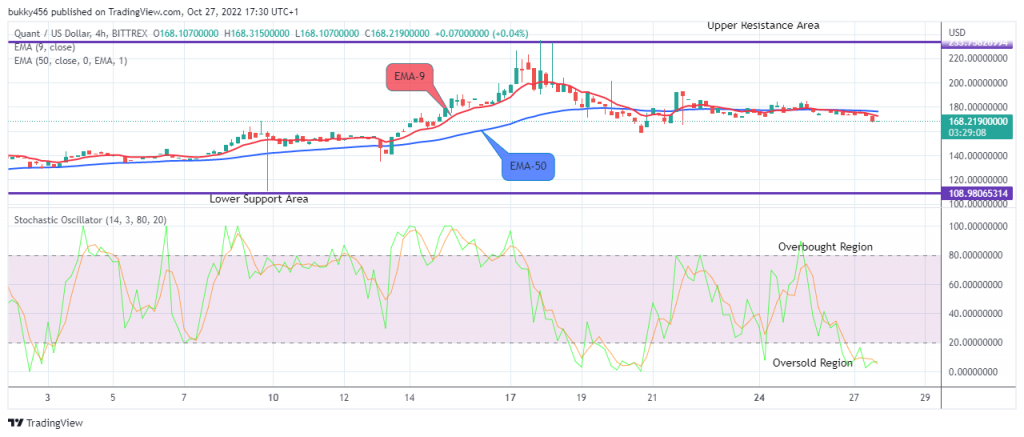
The QNTUSD is also trading in a bearish zone on the 4-hourly chart. The prices are seen below the resistance trend levels.
The inflow from the bears has dropped the coin price down to the $168.107 support value below the moving averages which are glued together. However, investors can buy the coin with the current trend at a lower rate and will still make gains out of it in the future.
Hence, the price of Quant will still go uphill soon as the selling pressure has been exhausted as shown by the price indicator. This will enable the bulls to commence the upward movement and the $400.000 resistance level might be reached sooner in its medium-term outlook.
Place winning Quant trades with us. Get QNT here


Leave a Reply