Quant Price Forecast: March 20
The QNTUSD price is bound to increase further and move up to gain more strength if all the existing support holds and the bulls decide to step up their efforts and breakup the $227.00 resistance trend line, the bullish correction pattern may extend the coin price to hit the $400.00 high mark. Thus, a turn around and clear buy signal for the coin holders.
Key Levels:
Resistance Levels: $250.00, $260.00, $270.00
Support Levels: $120.00, $119.00, $118.00 
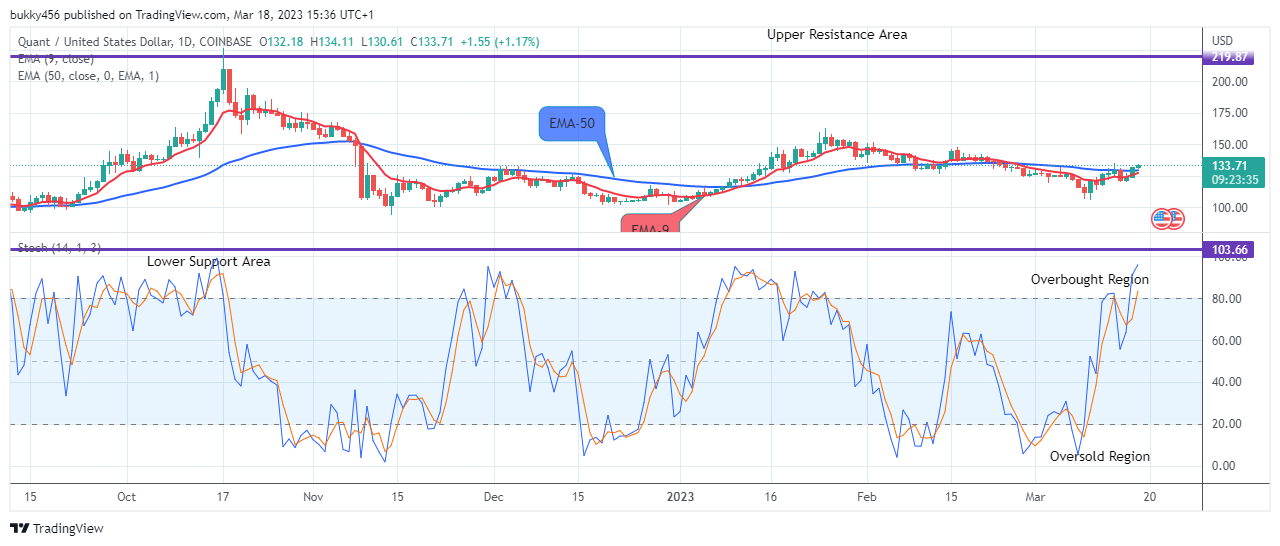
QNTUSD Long-term Trend: Bullish (Daily chart)
The momentum on the long-term outlook is still in an uptrend despite the inflows from the sell traders. The price of Quant can be seen above the moving averages. Thus, the bulls are capable of pushing higher from this trend line.
The pressure from the bulls to the $132.23 supply level during yesterday’s session has sustained the crypto price above the resistance trend lines in its recent high.
Today’s daily bullish candle at the $134.11 supply mark above the moving averages confirms the bulls’ dominance and readiness to push the market price higher. This breakup may possibly accelerate the bullish momentum and extend the ongoing correction to a higher level.
Additionally, there is likely to be a further increase in the price of QNTUSD as indicated by the daily signal which is pointing upwards. We can therefore expect the buy traders to push the coin price further above the overhead resistance trend line which may possibly reach the $400.00 upper supply trend line in the coming days in its higher time frame.
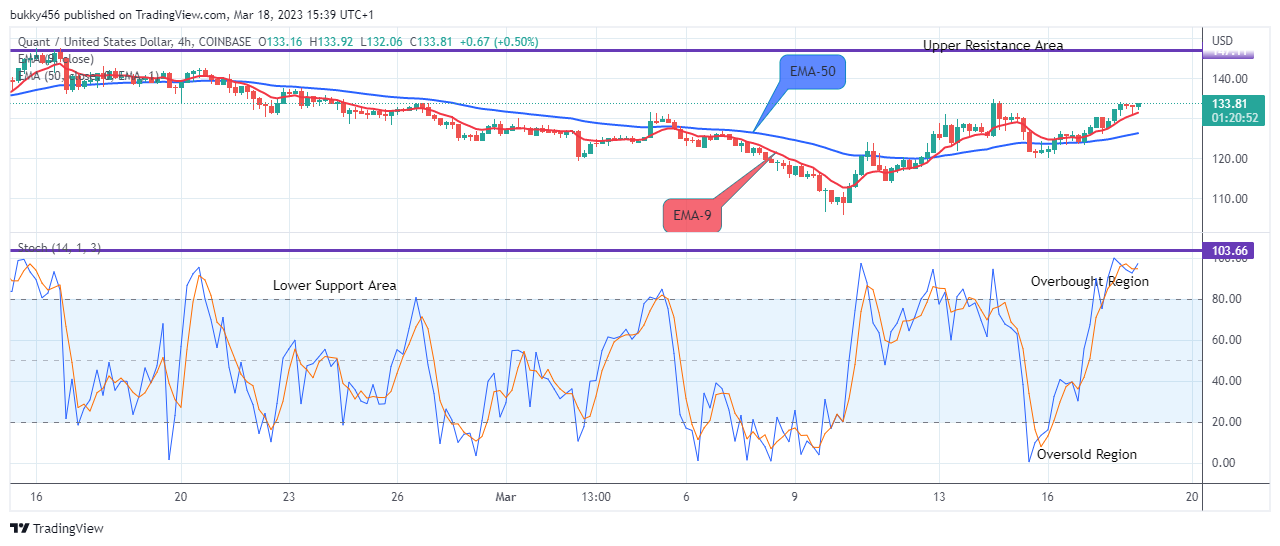
QNTUSD Medium-term Trend: Bullish (4H chart) QNTUSD Price Will Increase Further, Buy!
The QNTUSD pair remains bullish in its medium-term outlook. The price responded to the shift in the market structure and is currently above the moving averages. The bulls successfully pushed the coin price up to the $132.23 high value in the last session and sustained it in its recent high.
Despite the interruptions from the short traders, buyers successfully pushed the market price of Quant above the moving average lines at the $133.92 supply level above the supply trend levels as the 4-hourly chart opens today.
Thus, if the bulls should add more pressure to their buying activities in the market, the price tendency will move above the key levels and the bullish pattern may likely revisit the $147.06 high mark.
Meanwhile, the momentum indicator also shows that the market price of Quant is in an uptrend. This means that the bulls might continue the bullish correction pattern, as a result the crypto might increase further to reach the $400.00 resistance level and beyond in the days ahead in its medium-term perspective.
Place winning Quant trades with us. Get QNT here


Leave a Reply