Quant Price Forecast: July 27
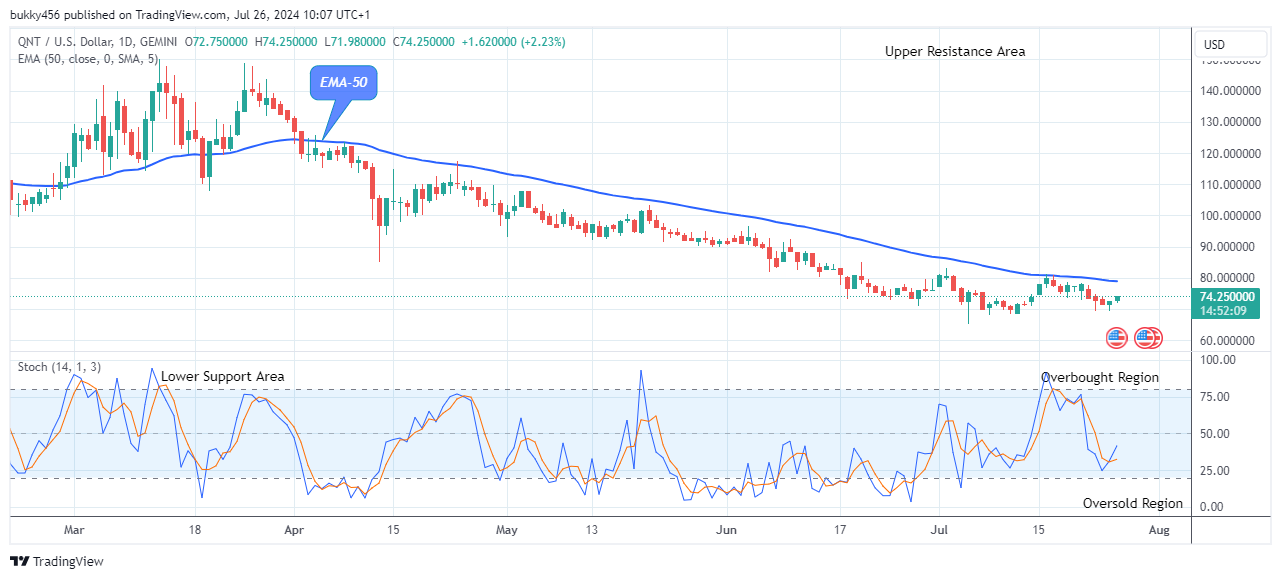
QNTUSD price hits resistance at the $74.25 threshold as it continues with the bullish pressure. At the moment, the pair is trying hard not to fall by resisting sellers. Based on the outlook, should the daily candlestick close above the $150.00 supply mark, the correction phase might extend to meet the resistance at the $ 160.00 trend line, indicating a potential price increase in the future.
Key Levels:
Resistance Levels: $80.00, $90.00, $100.00
Support Levels: $67.00, $66.00, $65.00
QNTUSD Long-term Trend: Bearish (Daily chart)
Coupled with increasing prices, the QNTUSD pair hits resistance at the $74.25 threshold as it trends upwards in the long-term perspective. The price bars are below the moving averages, confirming a bearish momentum. 
The sustained bearish pressure at the $71.22 support value in the past few days has made the crypto price drop below the supply levels in its recent low.
The coin buyers returned the Quant price to hit the resistance 74.25 thresholds below the EMA-50, as the journey up north continues on the daily chart today. However, there is likely to be a steady increase as the coin is set for a bullish pattern continuation rally.
Meanwhile, the current price shows a power struggle at the overhead resistance trend line, resisting the start of another bear cycle.
Thus, should the bulls change their orientation and the buying pressure persists, the coin could give a bullish breakout from the current supply value to hit the $150.00 threshold, leading the Quant price to hit resistance at the $160.00 upper high mark in the coming days in its long-term perspective.
QNTUSD Medium-term Trend: Bullish (4H chart)
QNTUSD rebounded after its downside moves. The coin price hits resistance at the $75.24 threshold as it continues to climb toward the overhead resistance level in its medium-term time frame. The market shows that the price may now be trading in a new ascending channel. 
The bulls have sustained the crypto market at the $72.63 supply value in the previous action, making it possible for the coin to stay above the trend line and remain stronger in its recent high.
The Quant price on the 4-hourly chart currently hits resistance at the $74.25 threshold facing the overhead resistance slightly above the EMA-50 and also approaching the retest of the previous high at the$82.04 level. Therefore, if the bulls increase their tension in the market, the price tendency will move above the key levels.
In addition, the price of QNTUSD may likely continue its bullish waves as indicated by the daily stochastic, pointing in an upward direction. Thus, a daily close above the $84.02 high mark could invalidate further bearish outlook and hit the resistance at the $160.00 threshold in the coming days in its medium-term perspective.
Place winning Quant trades with us. Get QNT here
Learn to Trade Forex Online
Quant (QNTUSD) Price Hits Resistance at $74.25 Threshold
Footer

ForexSchoolOnline.com helps individual traders learn how to trade the Forex market
WARNING: The content on this site should not be considered investment advice and we are not authorised to provide investment advice. Nothing on this website is an endorsement or recommendation of a particular trading strategy or investment decision. The information on this website is general in nature so you must consider the information in light of your objectives, financial situation and needs.
Investing is speculative. When investing your capital is at risk. This site is not intended for use in jurisdictions in which the trading or investments described are prohibited and should only be used by such persons and in such ways as are legally permitted. Your investment may not qualify for investor protection in your country or state of residence, so please conduct your own due diligence or obtain advice where necessary. This website is free for you to use but we may receive a commission from the companies we feature on this site.
We Introduce people to the world of currency trading. and provide educational content to help them learn how to become profitable traders. we're also a community of traders that support each other on our daily trading journey
Forexschoolonline.com is not a financial advisor. Do your research before investing your funds in any financial asset or presented product or event. We are not responsible for your investing results.

Leave a Reply