Quant Price Forecast: August 3
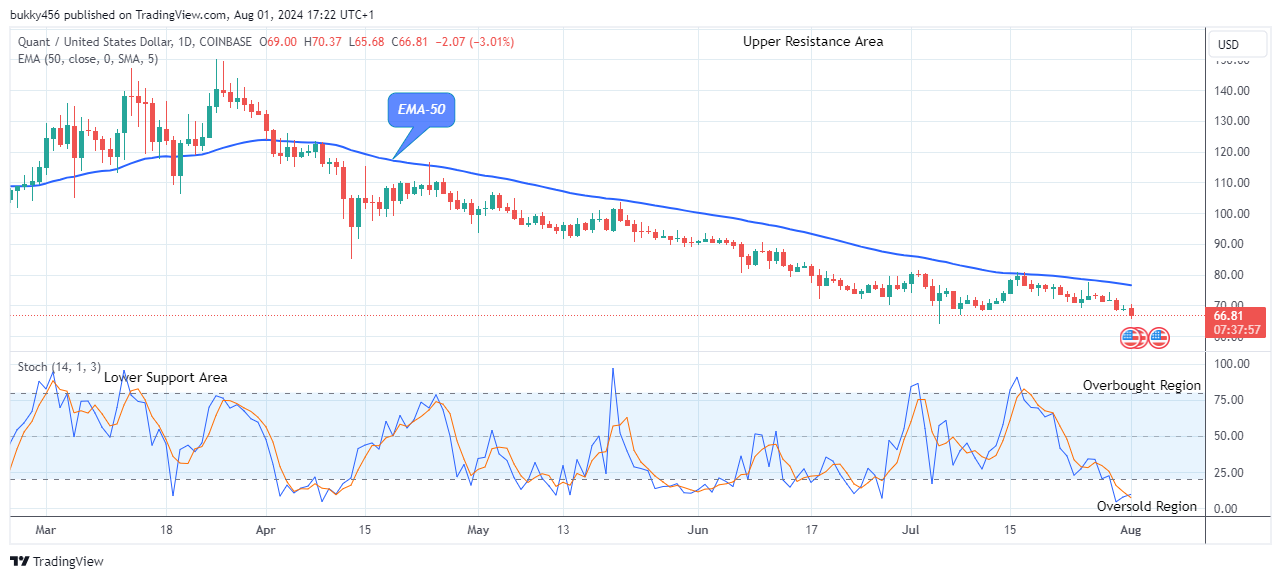
The market price of QNTUSD could see another bullish pattern soon to overcome sellers’ congestion. The coin traders seem ready for a possible reversal at the $65.68 daily support level to resume its upside moves soon. Should the bulls push higher and rebounded at the $65.68 support level, a bullish breakout confirmation above the $150.00 previous barrier level will reflect the improved market sentiment, footing for buyers to prolong the recovery to a $160.00 upper resistance point, keeping the course clear for more potential gains.
Key Levels:
Resistance Levels: $80.00, $90.00, $100.00
Support Levels: $65.00, $55.00, $45.00
QNTUSD Long-term Trend: Bearish (Daily chart)
QNTUSD indicates a downward trend and could see another bullish pattern soon as the selling pressure seems to end shortly in its long-term perspective.
The coin is trading below the EMA-50, confirming its low trend. However, the current trend could see another bullish pattern soon as the market is already oversold.
The sustained bearish pressure at the $68.27 support value in the last few days has made the Quant price drop below the supply levels in its recent low.
The price of Quant at the $65.68 low value below the two EMAs as the daily chart opens today is a result of low bullish momentum.
Should the bulls push higher and overcome the sellers’ congestion at the $65.68 current support level, a larger move to a $150.00 previous barrier will follow, keeping the course clear for a higher target at the upper resistance area.
Meanwhile, the QNTUSD market indicates an uptrend in the oversold region. It means that the crypto could see another bullish pattern soon and this might drive the upcoming bullish pattern to hit the $160.00 upper resistance level in the days ahead in its long-term outlook.
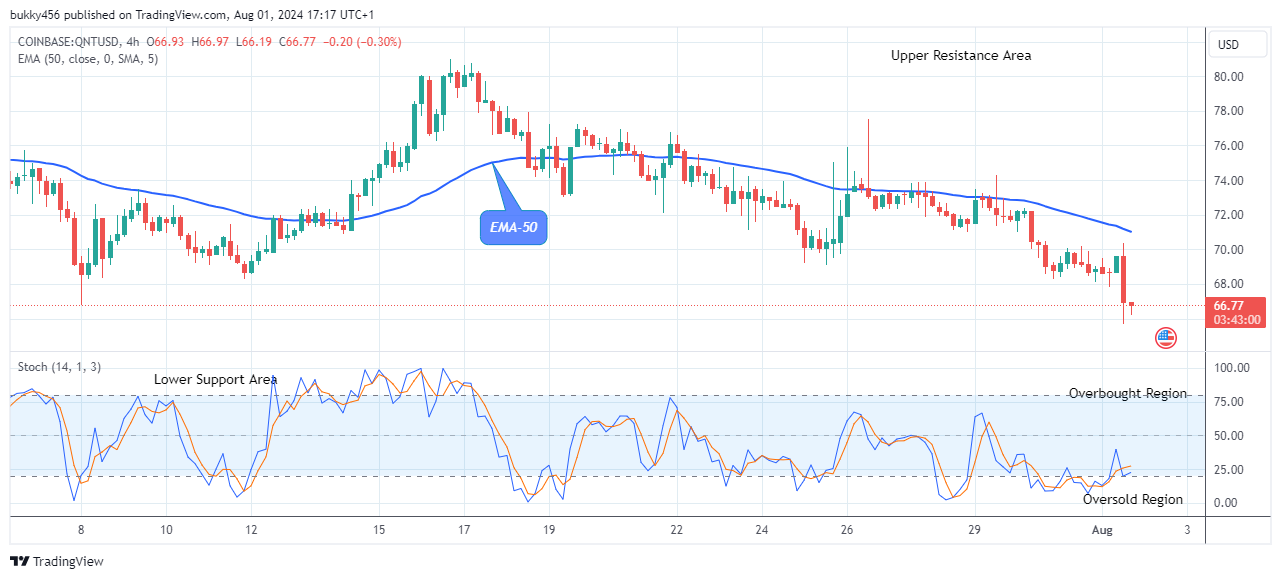
QNTUSD Medium-term Trend: Bearish (4H chart) QNTUSD Price Reversal at the $66.19 Support Level
The QNTUSD pair could see another bullish pattern soon, as the selling pressure is not likely as shown on the chart below in its medium-term outlook.
The high order flow from the bears to a $68.44 low value during the last session also added to its bearishness in its recent low.
As the 4-hourly chart begins today, bearish actions sent the Quant price to the $66.19 support level below the EMA-50. With strong buying pressure and positive market sentiment, the crypto may reverse at the current $66.19 support to see another bullish pattern, attracting more buyers to invest in the coin.
Next, the coin is in an upward direction on the daily stochastic. Therefore, if additional selling pressure is prevented, a post-retest rally may drive the prices high to hit the $160.00 resistance value soon in its medium-term time frame.
Place winning Quant trades with us. Get QNT here


Leave a Reply