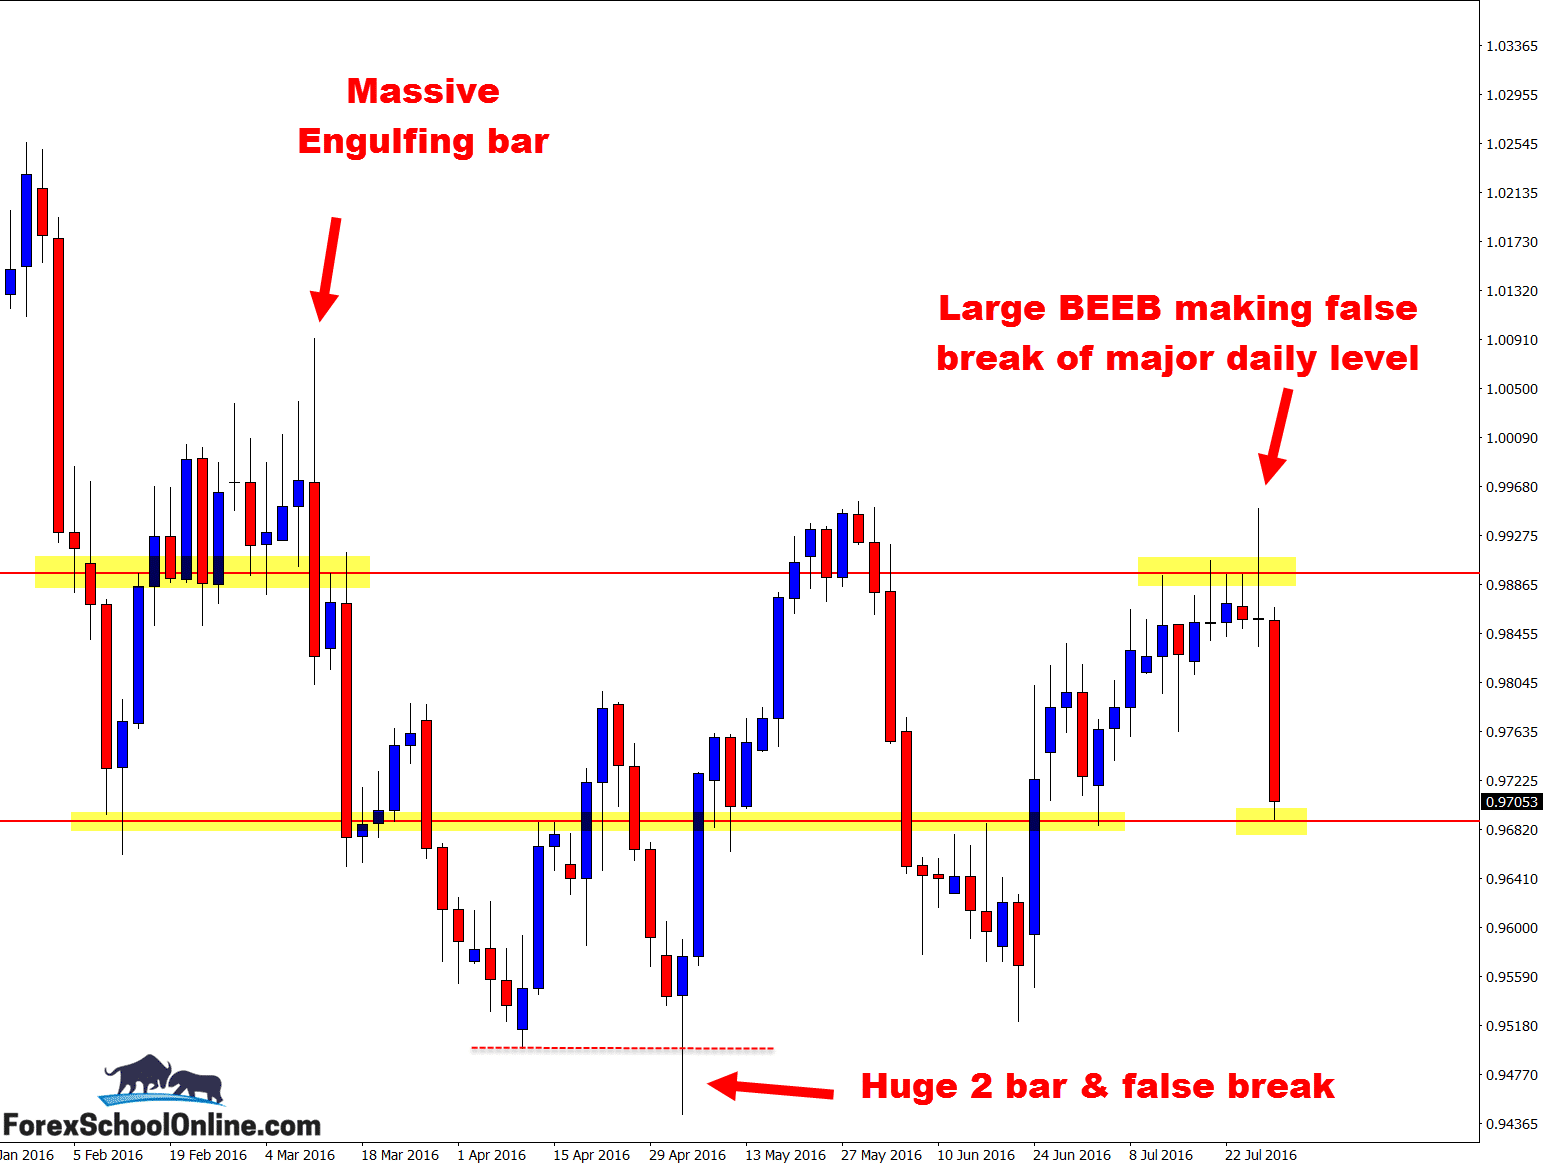
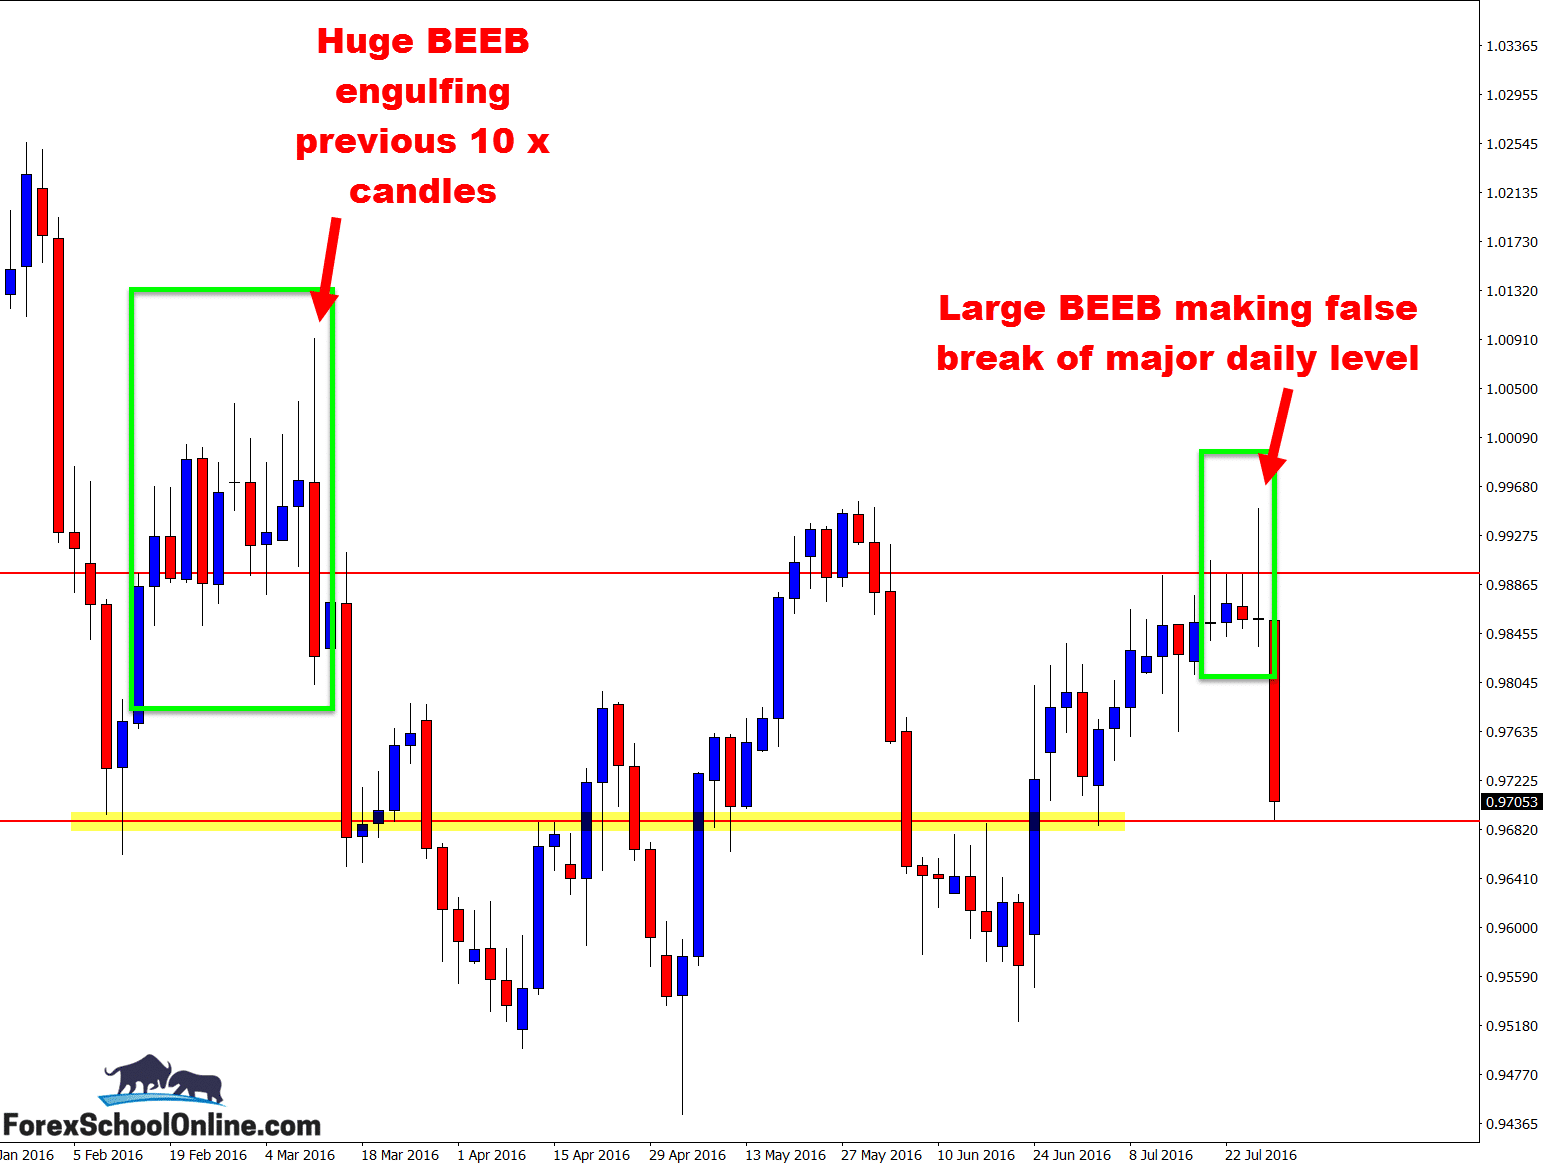
Just lately we have had a spurt of price action triggers and formations that have formed on a time frame other than our ‘standard‘ time frames. That theme carries on here as well, with a large False Break that is also a Bearish Engulfing Bar (“BEEB”) on the 2 day time frame chart.
This setup will confuse a lot of traders, with many asking themselves “Why is he calling that candle an engulfing bar?” and wondering if they are looking at the same candle.
The answer is yes they are, and as you can read in the Introduction to Trading the Bullish & Bearish Engulfing Bars two of the main rules to engulfing bars forming are:
- For a bearish engulfing bar to be valid it MUST have a higher high and a lower low – in other words, IT MUST fully engulf at the minimum the previous candle.
- The very best high quality engulfing bars close in the last 1/3rd of the candle in the direction that we are looking to trade. For example, if we are looking to short trade a bearish engulfing bar then we would want that BEEB to close in the last bottom 1/3rd of its candle.
This second rule is VERY important and is something that as a price action trader you are constantly adding to your price action story pot to read the clues on where the market is going.
In the lesson The Secrets Traders Can Learn From Candlesticks & Price Action I talk about how you can learn SO MUCH just from being able to read where price has closed or where it is not able to close.
When you are able to start combining these sorts of price action clues with other ones, such as where a trigger signal has closed in relation to the rest of the price action, then you will be able to really take advantage of the other traders!
NOTE: If you want to create your own 2 day time frame charts or any other time frame charts with your Metatrader platform like 8 hour, 6 hour, 2 hour etc, then go to the lesson: Change MT4 Time Frame EA Indicator
2 Day USDCHF Chart

2 Day USDCHF Chart

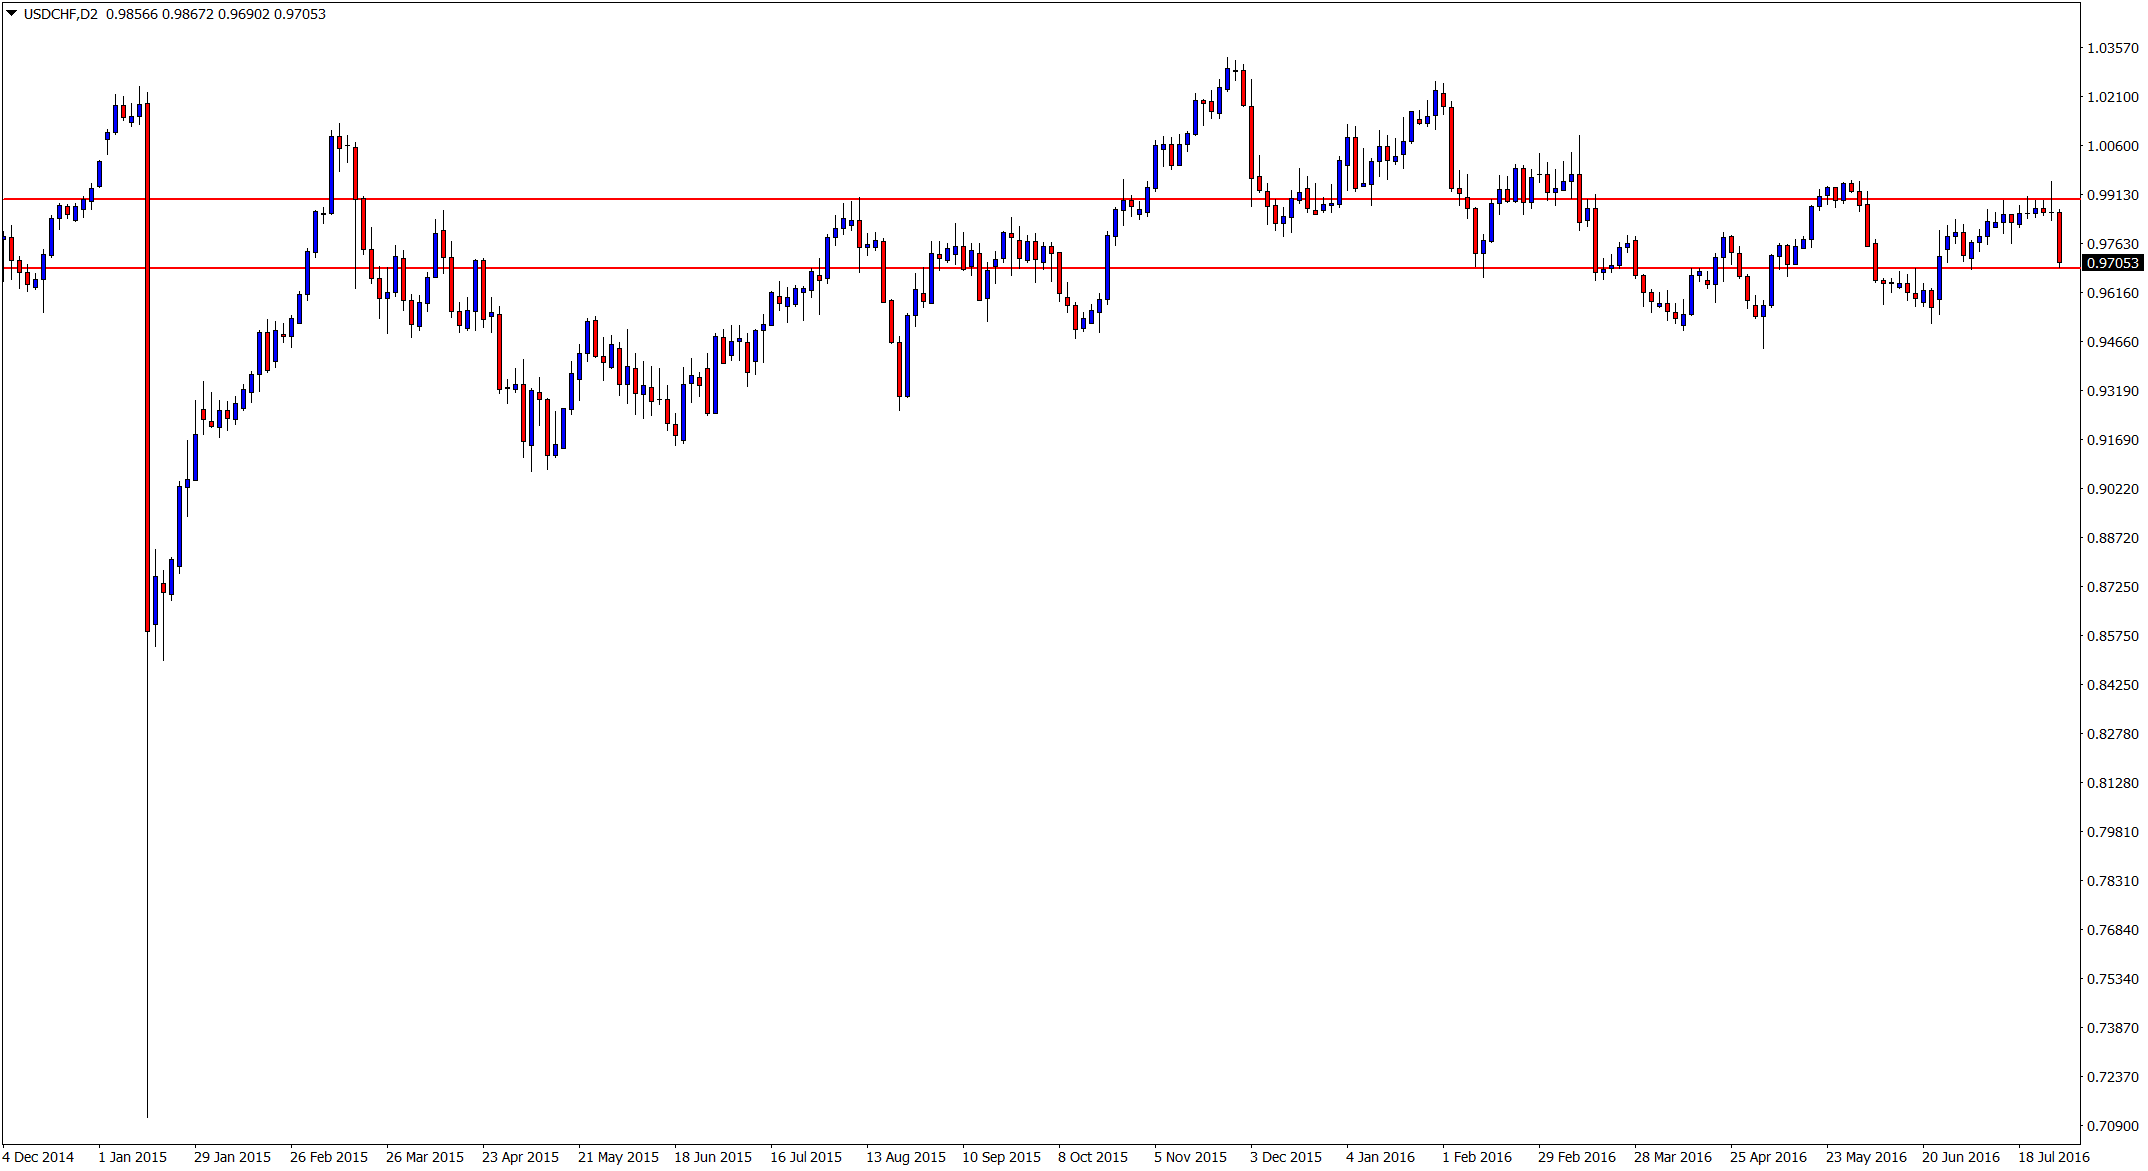
2 Day USDCHF Chart – Zoomed Out

Related Forex Trading Education


Leave a Reply