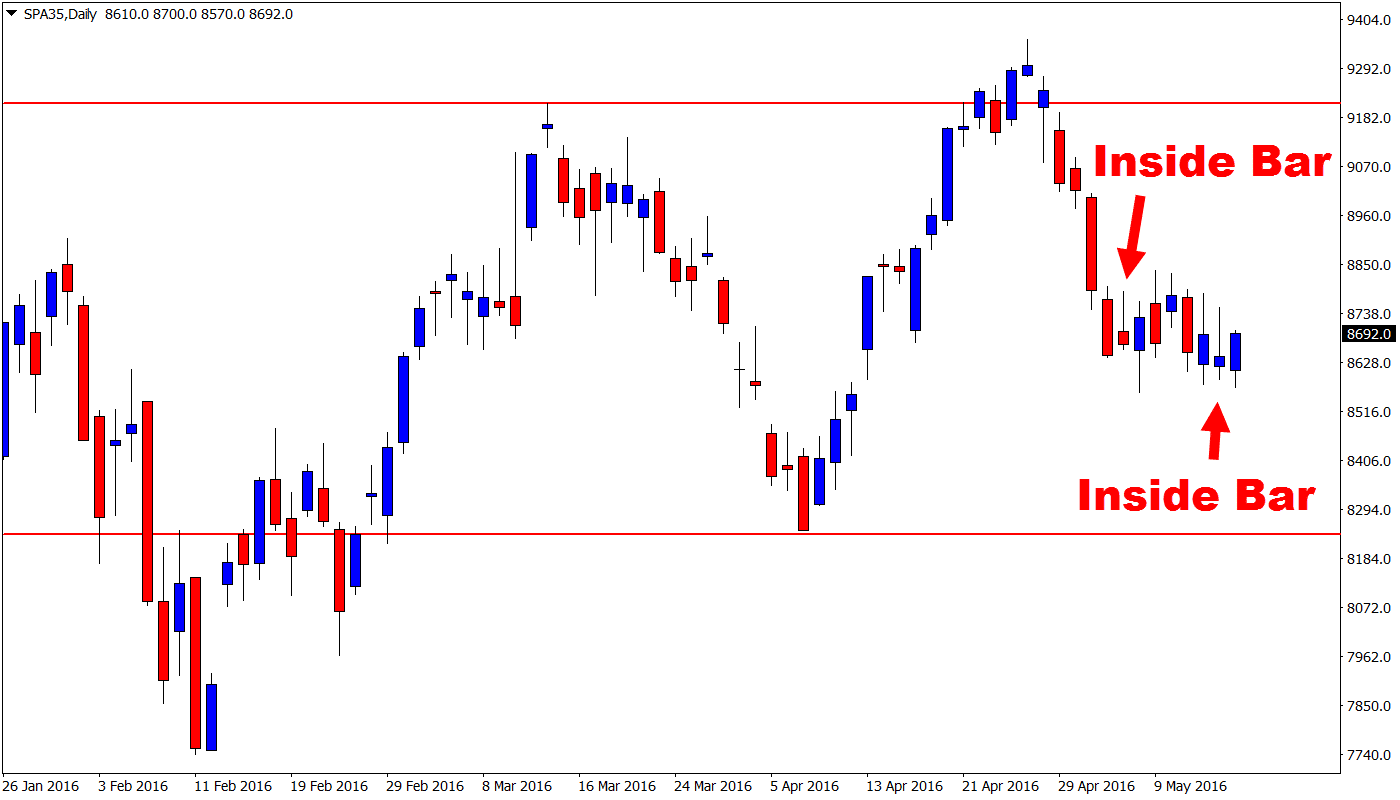
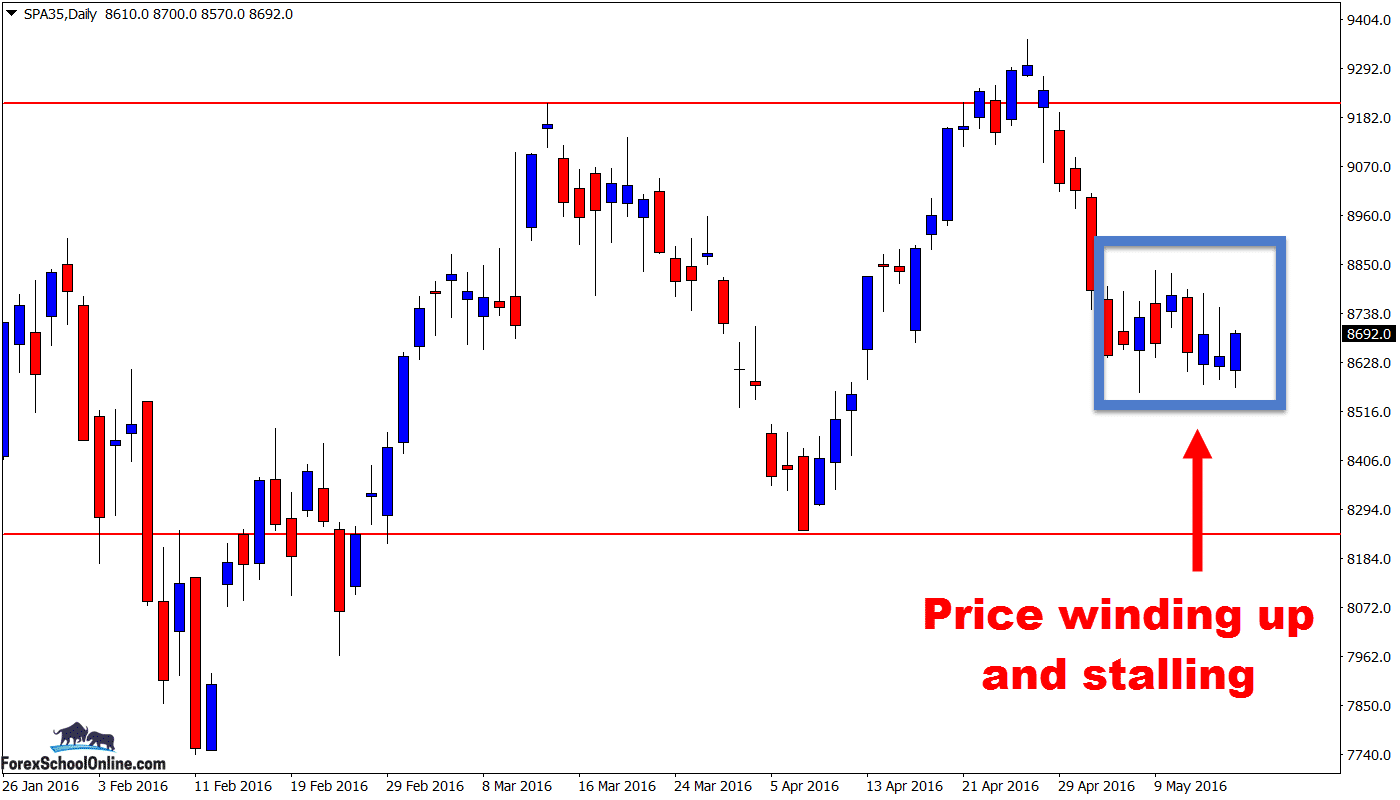
Price on the daily chart of the Spain 35 Index has moved into a period of very tight sideways stalling and consolidation, after attempting to make a break past the inside bar and continue down to the major support level.
As you can see on the chart below and as I alluded to in my heading, price is now winding up in a tight box. After rejecting the range high, price made a strong move lower. It then stalled and formed a small inside bar. After trying to continue lower and failing, price has been unable to break the deadlock ever since, forming another inside bar today and moving directly sideways in the process.
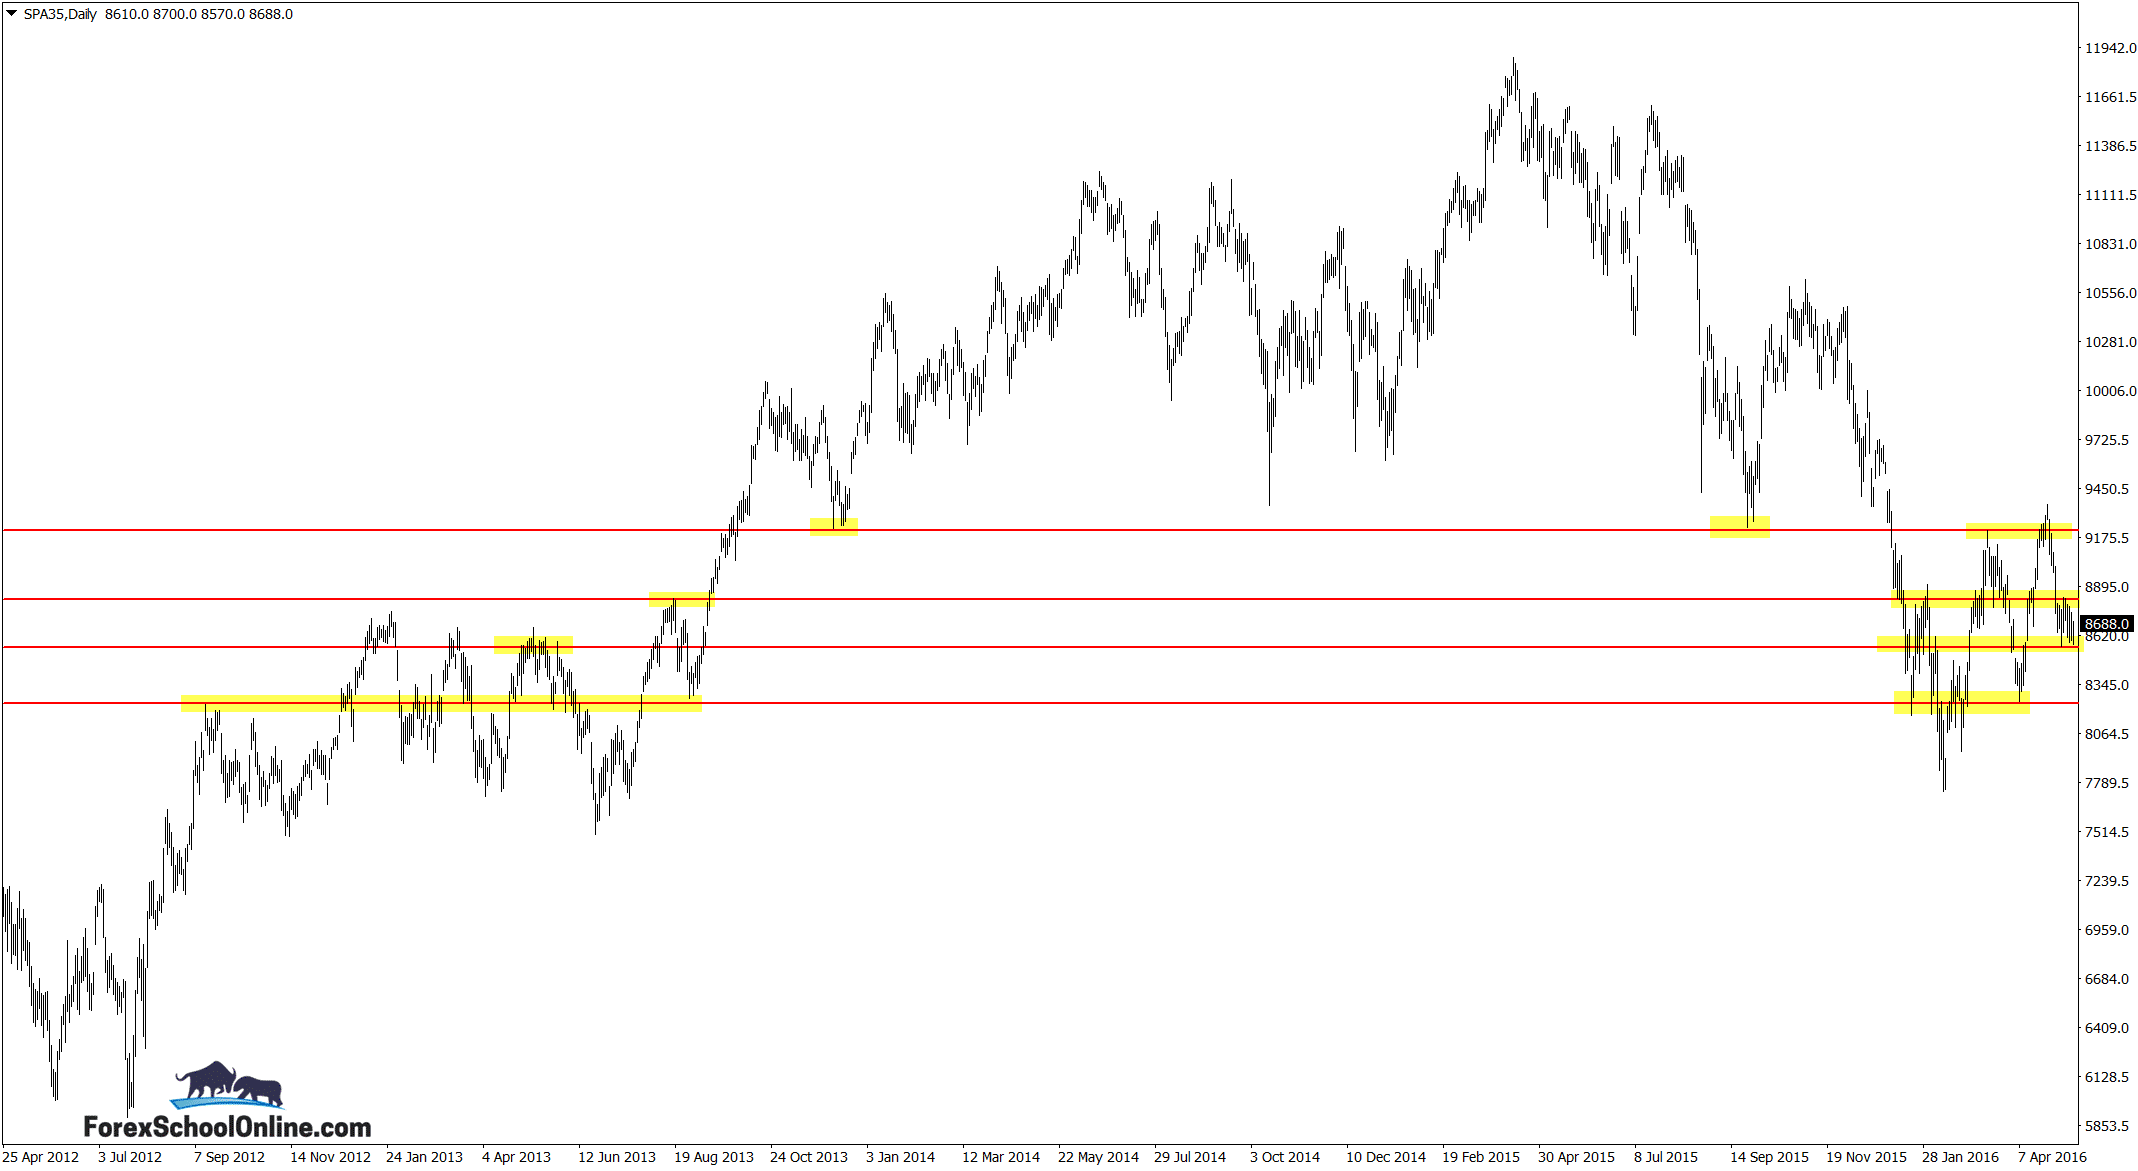
There are pretty clear and solid levels for this market and they are well respected. This is also a very good market to trade for price action traders as not only does it respect it levels, but it has good conditions to trade under. There is good volatility, i.e. price makes good solid moves and other than at the weekends there are rarely unexpected or unexplained movements – taking into account the fact that this is a stock index.
The two major range levels are pretty clear, with the range high and range low the really key levels to come into play here. As we always teach and I press home in these situations, we need to be both mindful and careful that we do not get suckered into making any trades in the ‘no-man’s land’. This is the area between the range high and low and where a lot of traders will fall prey to sucker price action trades.
We can still makes trades when the market is in a range, BUT we need to follow a few key rules. The highest probability trades and also the trades where the highest risk rewards are found are at these major highs and lows. I teach you exactly how to do this in the Forex trading lesson:
Spain 35 Daily Chart
Spain 35 Daily Chart

Spain 35 Daily Chart


Leave a Reply