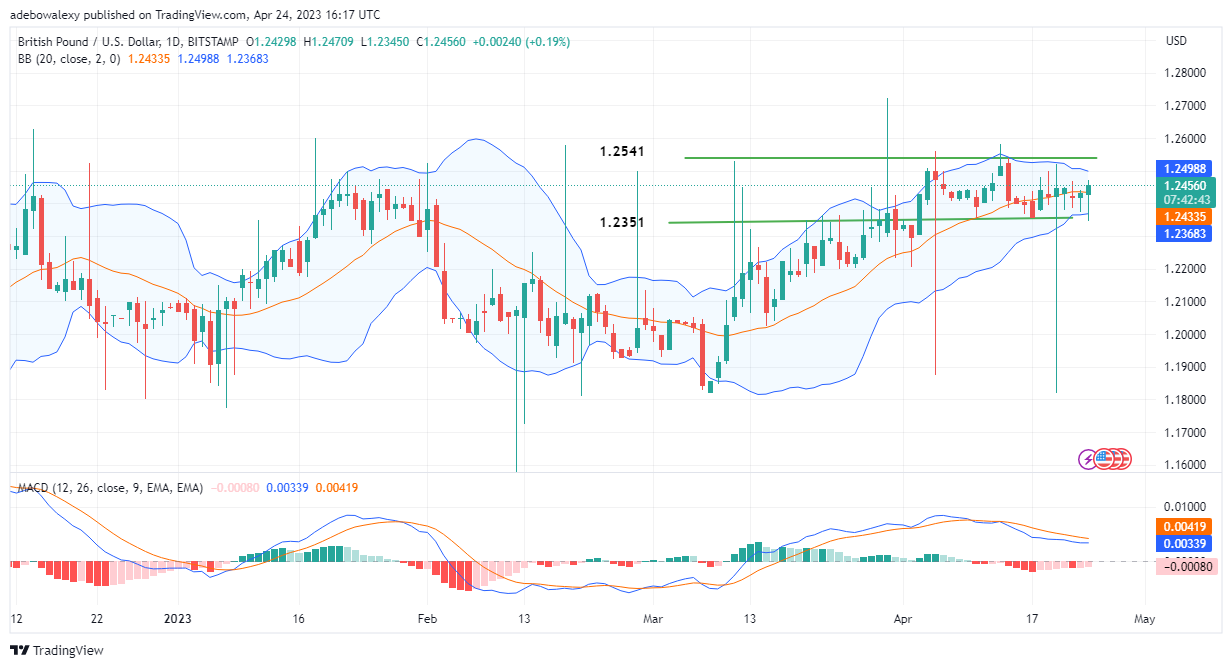
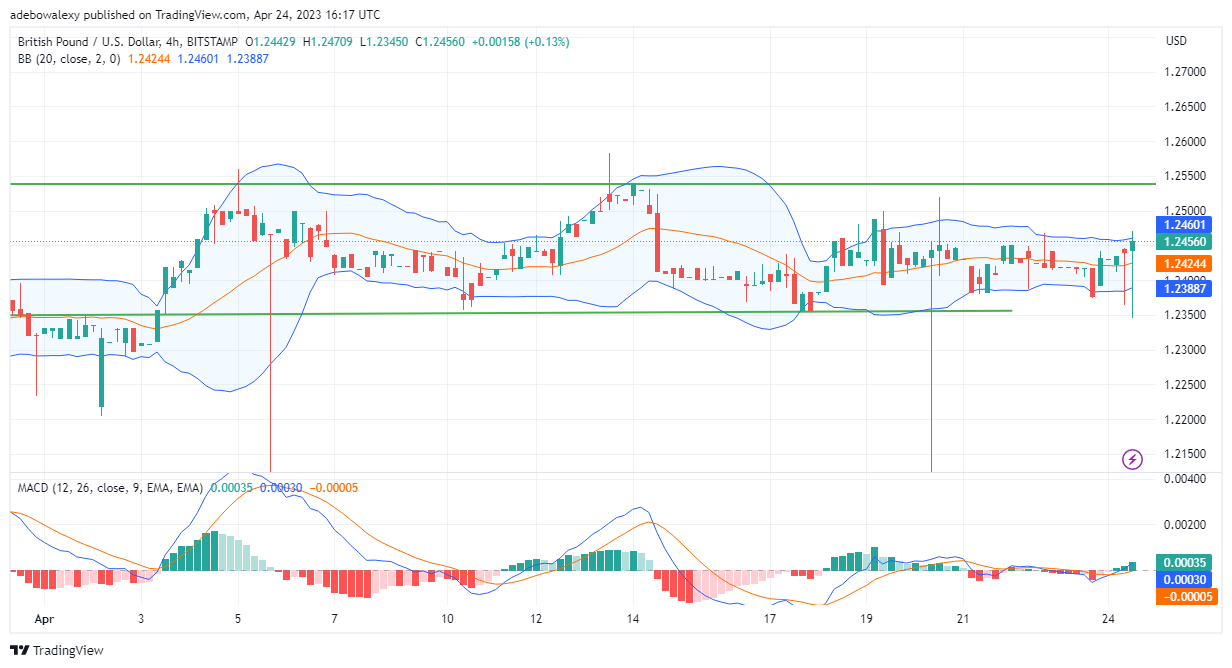
After GBP/USD Price Action regained enough traction to break the 1.2435 price mark, it has since retraced further upwards to hit the 1.2456 mark. At this level, price action has more chances of advancing towards 1.2500 as trading activities continue.
Major Price Levels:
Top Levels: 1.2456, 1.2476, and 1.2500
Floor Levels: 1.2430, 1.2400, and 1.2380

GBP/USD Price Is Set for More Upside Moves
As price action in reliance on the GBP/USD market has broken the resistance at 1.2435, the pair now has greater chances of hitting the 1.2500 mark. The last price candle on this chart seems bigger than the previous one and seems to suggest that bulls are growing stronger. Meanwhile, the lines of the Moving Average Convergence Divergence indicator have crossed above the equilibrium level and are now trending sideways following the price developments in the market. Consequently, this further confirms that price activities have more upside chances at this point.

GBP/USD Price Action Hits the Upper Limit of the Bollinger Bands and May Push Further
On the 4-hour time frame, price action is now testing the uppermost limit of the Bollinger Bands. Furthermore, price action seems to have the steam to push the mentioned limit upwards to extend profits in this market. This prediction stems from the fact that the bars of the Moving Average Convergence Divergence indicator are now vivid green and are getting taller as trading activities continue. The lines of this indicator have even crossed above the equilibrium point and seem ready to move higher. Therefore, traders can expect GBP/USD prices to hit the 1.2500 mark.
Do you want to take your trading to the next level? Join the best platform for that here.


Leave a Reply