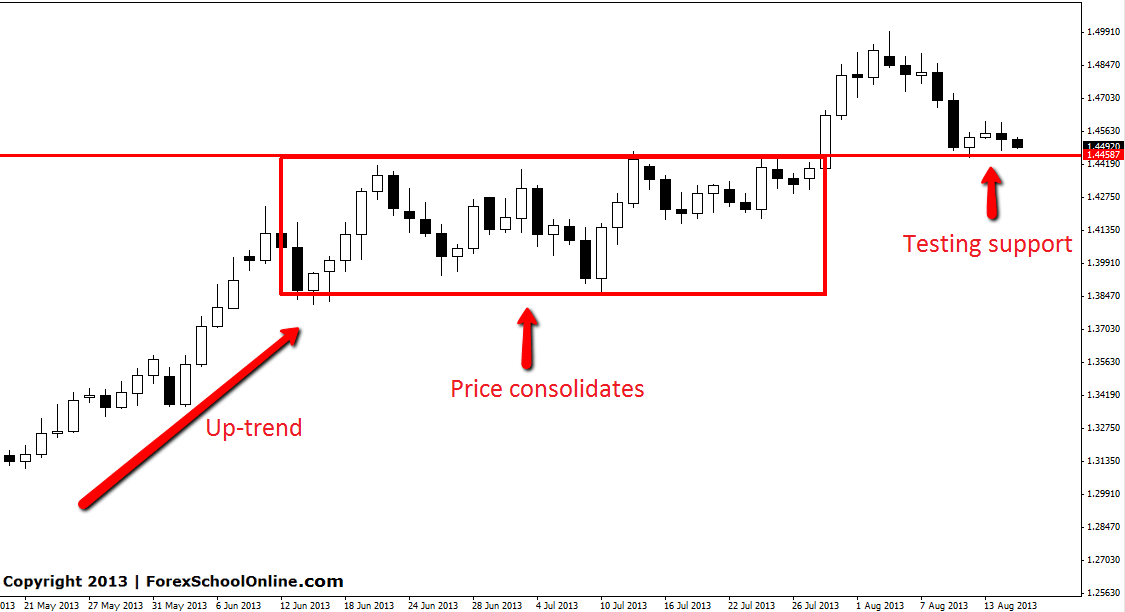
The daily chart of EURAUD is a very interesting one. As I am writing this blog post price is testing a key support level that is a proven level. Price is now looking to either possibly break this level and move higher or provide bullish price action at a key support for traders to get long from a key support.
On the daily chart we can see that price was in an up-trend. After a large move higher price moved into a large box of consolidation. This often happens and is a key market rule to how the market works. Price after a large move either higher or lower needs to build orders and consolidate to gain momentum for the next move. This is why price never moves straight higher or lower. This is also why price will often break out of the consolidation in the same direction that price was trending before price moved into the consolidation. You can read more about exactly how this pattern works here: Price Action Guide to How the Market Moves.
Once price broke out of the consolidation it move higher and it has now retraced lower to come back to test the old consolidation resistance which at this stage is acting as new support. If this level is to hold we are going to need to see some solid bullish price action. If we get a solid bullish price action setup on the higher time frame it could present a potential high probability trade. If price breaks through this support area, this level would then turn into a “Price Flip“.
EURAUD | 15TH AUG 2013


Leave a Reply