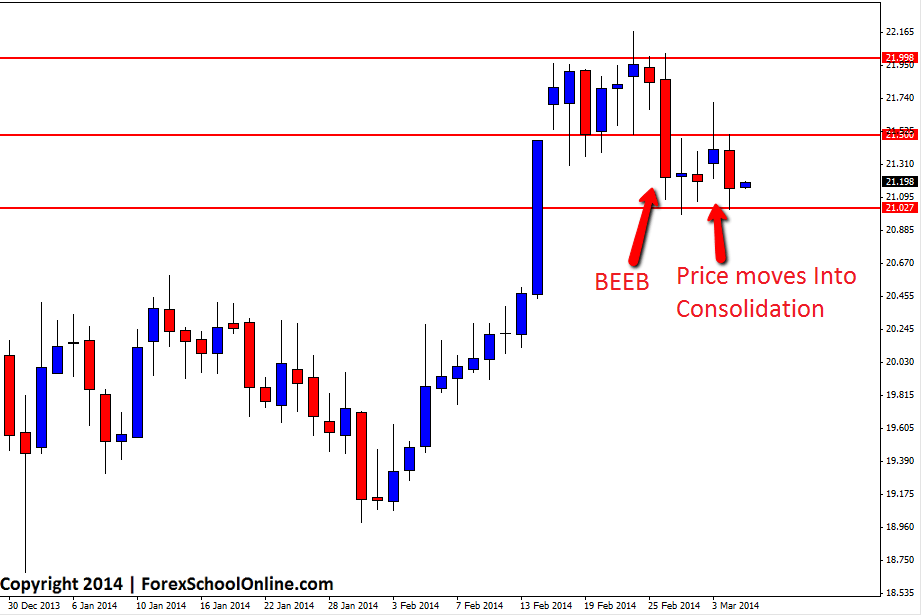
Price on the daily chart of Silver has moved right back into consolidation after forming a large Bearish Engulfing Bar (BEEB) that we discussed live in this blog and that you can read the original blog post to here: Silver Breaks Sideways Trading With Large Engulfing Bar. This Bearish Engulfing Bar (BEEB) broke and pushed price lower out of the tight wind up that price had been trading in. Until this BEEB, price had been winding up and trading in a tight sideways box formation which we originally posted about here: Silver Beginning Wind Up on Daily Chart.
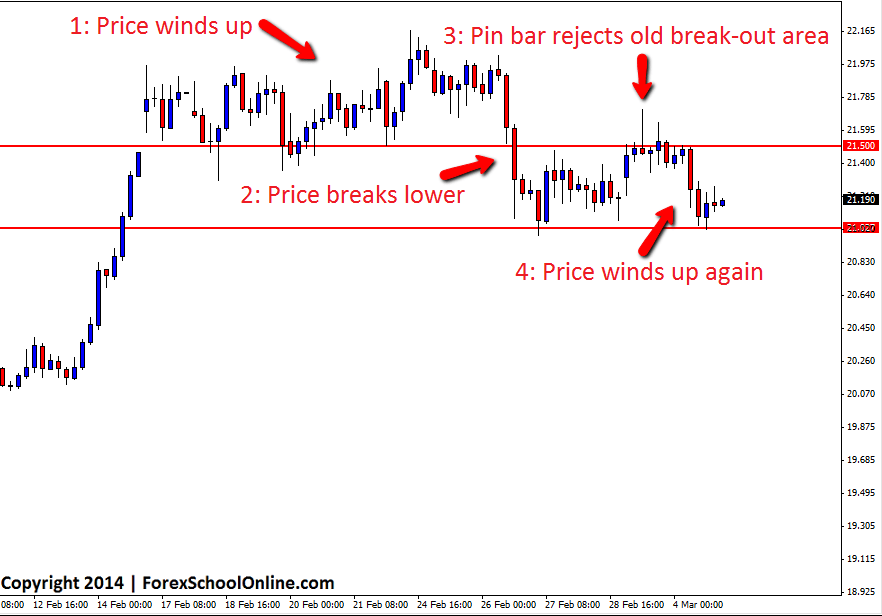
After price broke out of the tight sideways box after forming the BEEB, price retraced back higher to test the old breakout area. On the 4hr chart, price moved higher to test the old support area that previously contained price in the tight box from moving lower and this old support area acted as a price flip level and new resistance. Price on the 4hr chart fired off a pin bar up at the high, rejecting this new resistance area which has since seen price fall lower and back into the recent lows which traders can see on the second 4hr chart below.
Since moving back lower, price has again moved back into tight sideways range trading and winding up. From here traders need to keep eyes peeled for the next breakout and then another possible breakout – retrace trade similar to the 4hr setup discussed in this post.
Silver Daily Chart

Silver 4hr Chart


Leave a Reply