Polygon (MATICUSD) Price Forecast: May 29
The MATICUSD price will surge higher to retest the $1.549 high mark. The coin having rebounded will most likely continue its bullish correction and the price could go higher and hit the mentioned resistance value. If the bulls are able to break up the $1.549 supply mark, then we can expect a good upside momentum up to the $2.000 upper high value.
Key Levels
Resistance Levels: $1.400, $1.500, $1.600
Support Levels: $0.950, $0.850, $0.750
MATIC (USD) Long-term Trend: Bullish (Daily Chart)
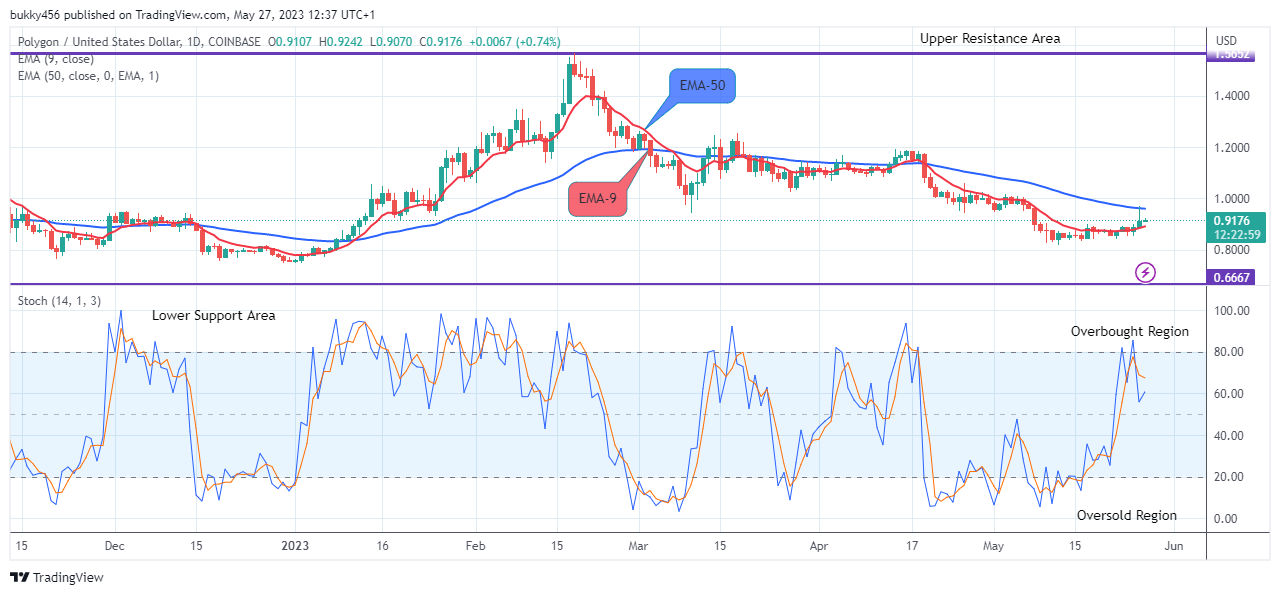
Polygon( MATICUSD) is in an upward trend with a bullish sentiment in its long-term perspective. The coin price can be seen above the EMA-9 on the daily chart. This is due to the high inflows from the buy traders.
The bulls were able to push the cryptocurrency up to the $0.910 resistance value during yesterday’s session and have enhanced the price to stay in green ready for an upward performance in its recent high.
Today’s coin price on the daily chart is currently facing resistance and trading at the $0.924 correction level above the EMA-9. Further, the rising prices reclaimed more confirmation for a bullish recovery. A strong breakup above the $1.466 resistance point would strengthen the bullish pressure.
In addition, the daily stochastic indicates an upward trend, this means that the buy investors may likely continue with the bullish correction pattern to retest the $1.549 high value which might further extend the MATICUSD price to reach the $2.000 resistance mark in the coming days in its long-term outlook.
MATIC (USD) Medium-term Trend: Bullish (4H Chart)
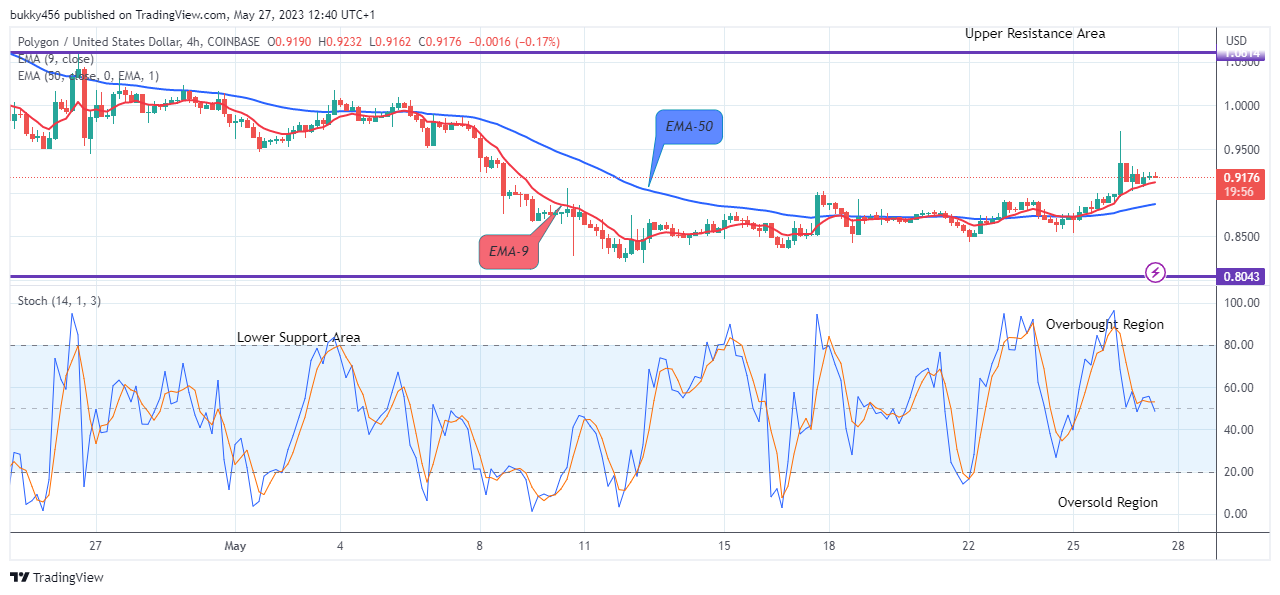
The currency pair’s orientation trades in a bullish market in its medium-term outlook. The price bar is seen above the moving averages.
The intervention from the buy traders at $0.921 in the previous action has kept the coin price above the supply trend line.
The drop in the price of Polygon to the $0.916 low value above the two EMAs as the 4-hourly chart commenced today has no serious effect on the market as the price remains in an uptrend.
Hence, staying above the supply levels indicates a strong possibility for a bullish correction. A strong breakup by the bulls above the $1.059 resistance point would strengthen the bullish pressure.
The Stochastic is also showing the market now approaches the oversold region. This means that the selling pressure will end soon. This will compel the bulls to resume the bullish trend to retest the $1.059 supply level; the $2.000 resistance level might be reached in the days to come in its medium-term outlook.
Buy Polygon on eToro
Learn to Trade Forex Online
Polygon (MATICUSD) Price Will Surge Higher to Retest the $1.549 High Mark
Footer

ForexSchoolOnline.com helps individual traders learn how to trade the Forex market
WARNING: The content on this site should not be considered investment advice and we are not authorised to provide investment advice. Nothing on this website is an endorsement or recommendation of a particular trading strategy or investment decision. The information on this website is general in nature so you must consider the information in light of your objectives, financial situation and needs.
Investing is speculative. When investing your capital is at risk. This site is not intended for use in jurisdictions in which the trading or investments described are prohibited and should only be used by such persons and in such ways as are legally permitted. Your investment may not qualify for investor protection in your country or state of residence, so please conduct your own due diligence or obtain advice where necessary. This website is free for you to use but we may receive a commission from the companies we feature on this site.
We Introduce people to the world of currency trading. and provide educational content to help them learn how to become profitable traders. we're also a community of traders that support each other on our daily trading journey
Forexschoolonline.com is not a financial advisor. Do your research before investing your funds in any financial asset or presented product or event. We are not responsible for your investing results.

Leave a Reply