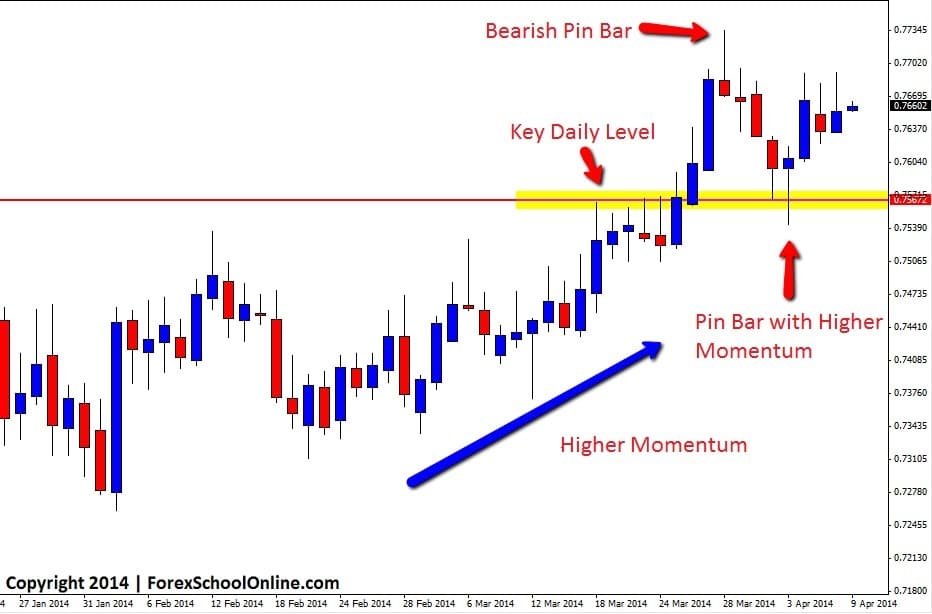
Recently in this blog I posted about a solid Pin Bar that had formed on the daily chart of the NZDCHF. You can read the original post that was made about that pin bar here: NZDCHF Fires Off False Break Pin Bar Reversal Whilst the pin bar on the NZDCHF was against the recent strong move higher, it was formed in an overall range and price was making a strong false break through the recent resistance showing a clear rejection.
Once price broke lower of this level and confirmed the pin bar by breaking the pin bars lows, price was able to make a commanding move very quickly into the next support level. For those traders who entered this particular setup, this move lower gave them a chance to take profit or at the minimum, a chance to take partial profit and to protect their capital by shortening stops.
It was at this next support level that price found support and fired off a bullish pin bar that was in-line with the strong recent momentum higher. This bullish pin bar was formed at a key daily level and whilst not a textbook pin bar because the nose of the pin bar was not protruding away from the previous candles as much as what would have been liked, price has since still moved higher back into the recent highs on the back of the strong recent momentum higher.
NZDCHF Daily Chart


Leave a Reply