NZDCHF Pin Bar Directly Into Trouble Area
The other day I posted an image on my social feeds asking about the major areas traders have trouble with the pin bar and in particular the 3 x major keys to playing the Pin Bar Reversal.

You can see that image below if you missed it and find the lesson here; The 3 x Keys to the Pin Bar Reversal
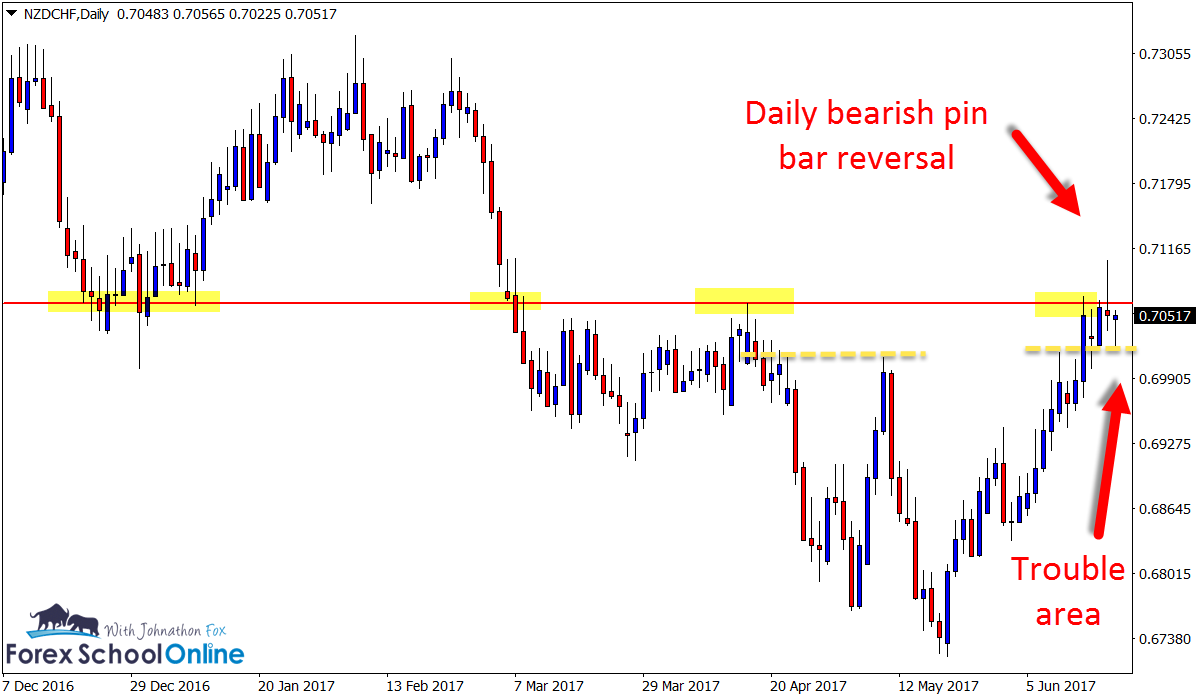
Just like with today’s first market; the “NZDCHF Daily Pin Bar”. After we have found a good price action story to make the pin bar, and the pin bar itself is up or down at a good spot and meets all the ticks in the box, it needs to then…
NOT be trading straight into a support or resistance area.
If we enter a trade where price is moving directly into a support / resistance, supply / demand or a big bunch of buyers and sellers waiting to jump into the market, then we severely limit the chance of making a successful trade = which is why I discuss the whole price action story time and again.
If you have a look at the NZDCHF now price is attempting to break the low of the pin bar reversal and make a serious move lower – and this could as yet happen. As we know breaks either higher or lower are happening all the time
We are trading edges and odds, and the odds are not to trade into levels or make a trade entry into a support / resistance level.
Daily NZDCHF Chart

Sugar Daily Chart
This market has been an absolute hotbed of price action trigger signals on the daily and intraday charts in recent months and nearly all of them in-line with the strong momentum lower.
This is a market that I have personally been posting about and discussing a heck of a lot about in the student’s summary and forum because as other traders have started trading it more, it has become more reliable, with less gaps and more free flowing price action over time.
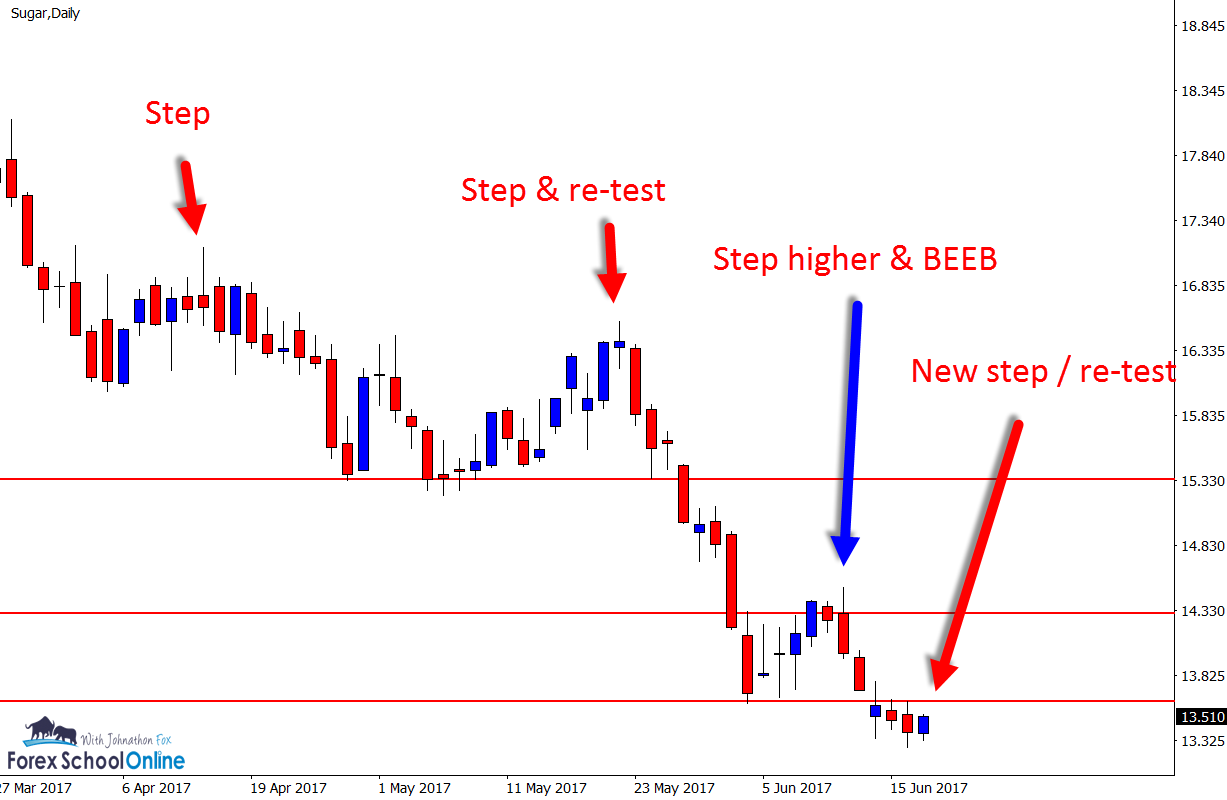
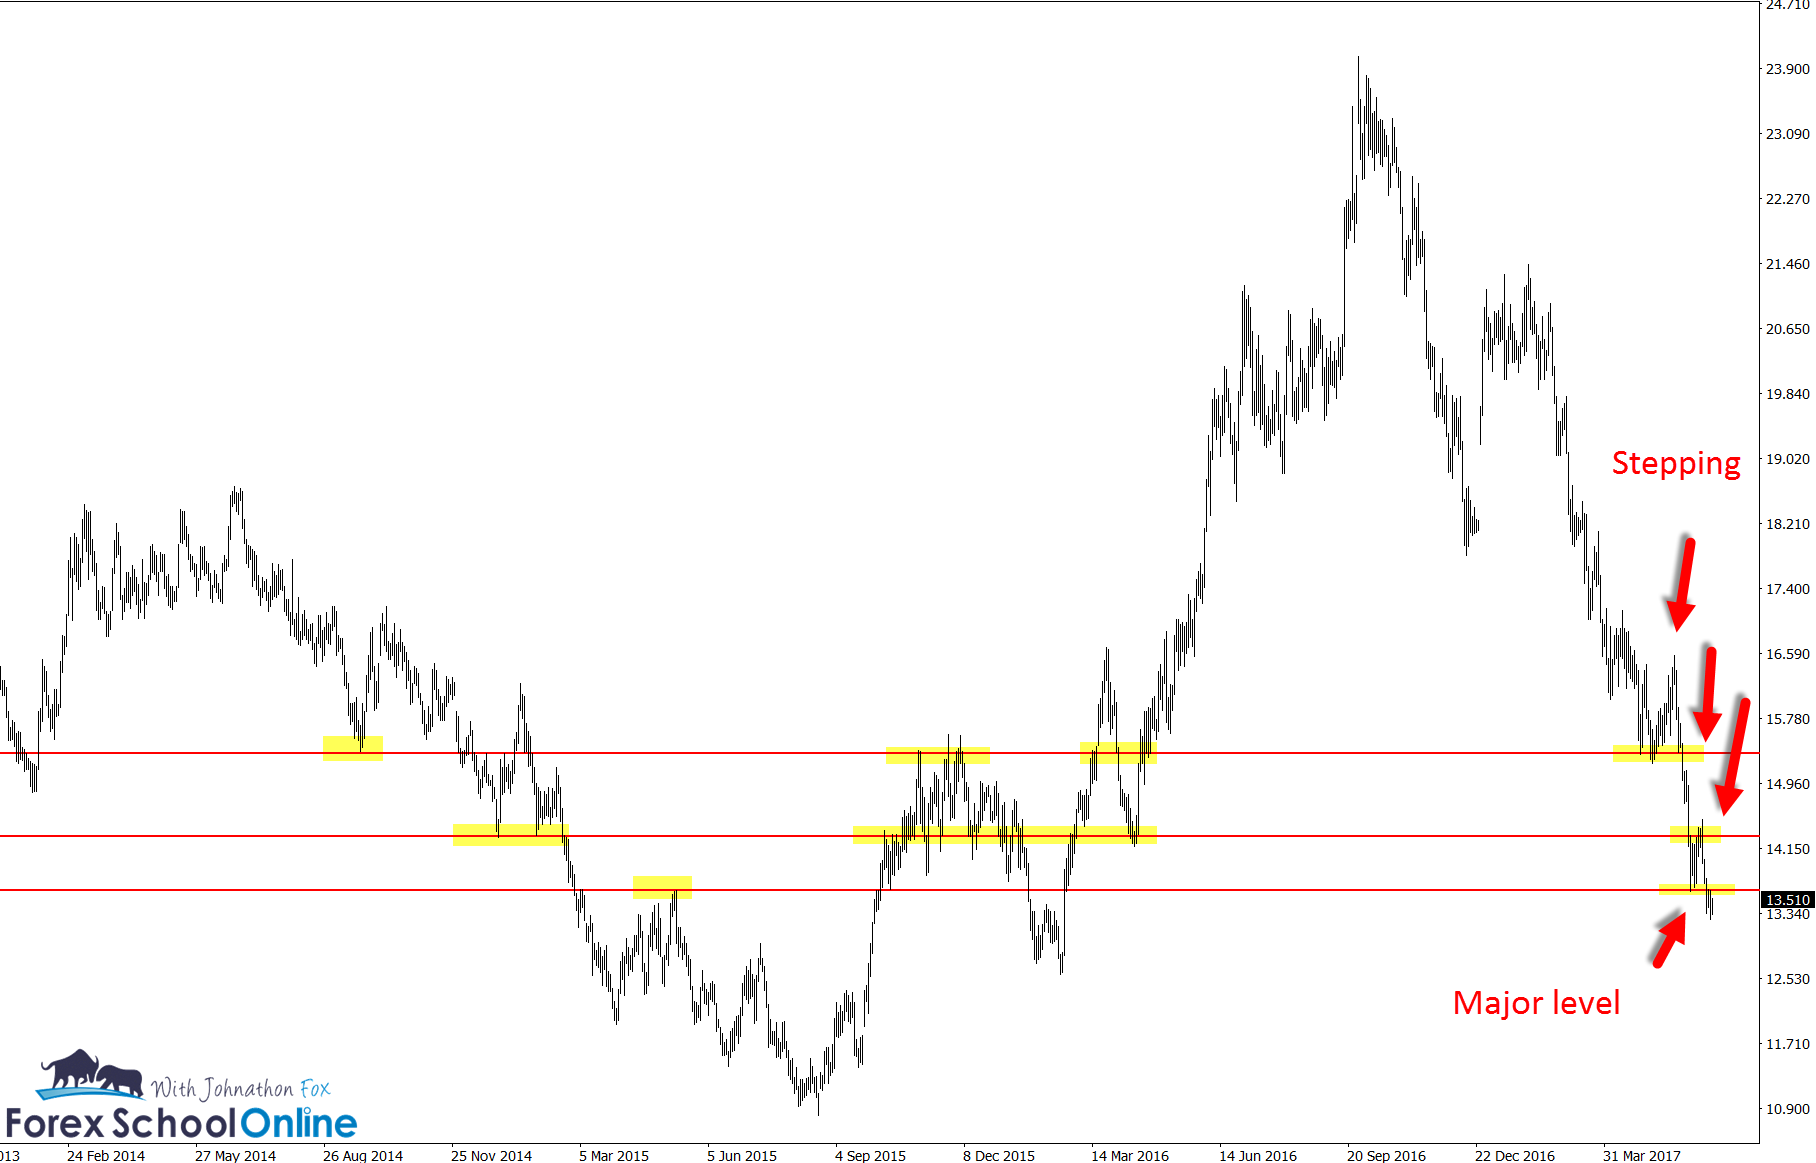
In recent times we can see price making a solid trend lower and forming what we call ‘stepping’ where price begins to step lower.
This is something you should keep a close eye out for, especially when price makes the rotations back into the value areas.
When price rotates back into value we can look to join into the strong move and join the next step higher or lower, just like this recent Bearish Engulfing Bar = BEEB Sugar formed (quick shout out to Mrgreen for posting this one up in the Students forum).
Now, in this markets and these similar sorts of price action setups we watch not just on the daily, but those who trade the intraday can also look for intraday triggers to get short and make A+ high probability trades.
Sugar Daily Chart

Sugar Daily Chart

You can learn about first test support / resistance and trading the stepping area in this lesson here; The Key Rules to How the Markets Moves


Leave a Reply