First of all;
Happy Australia Day!!!
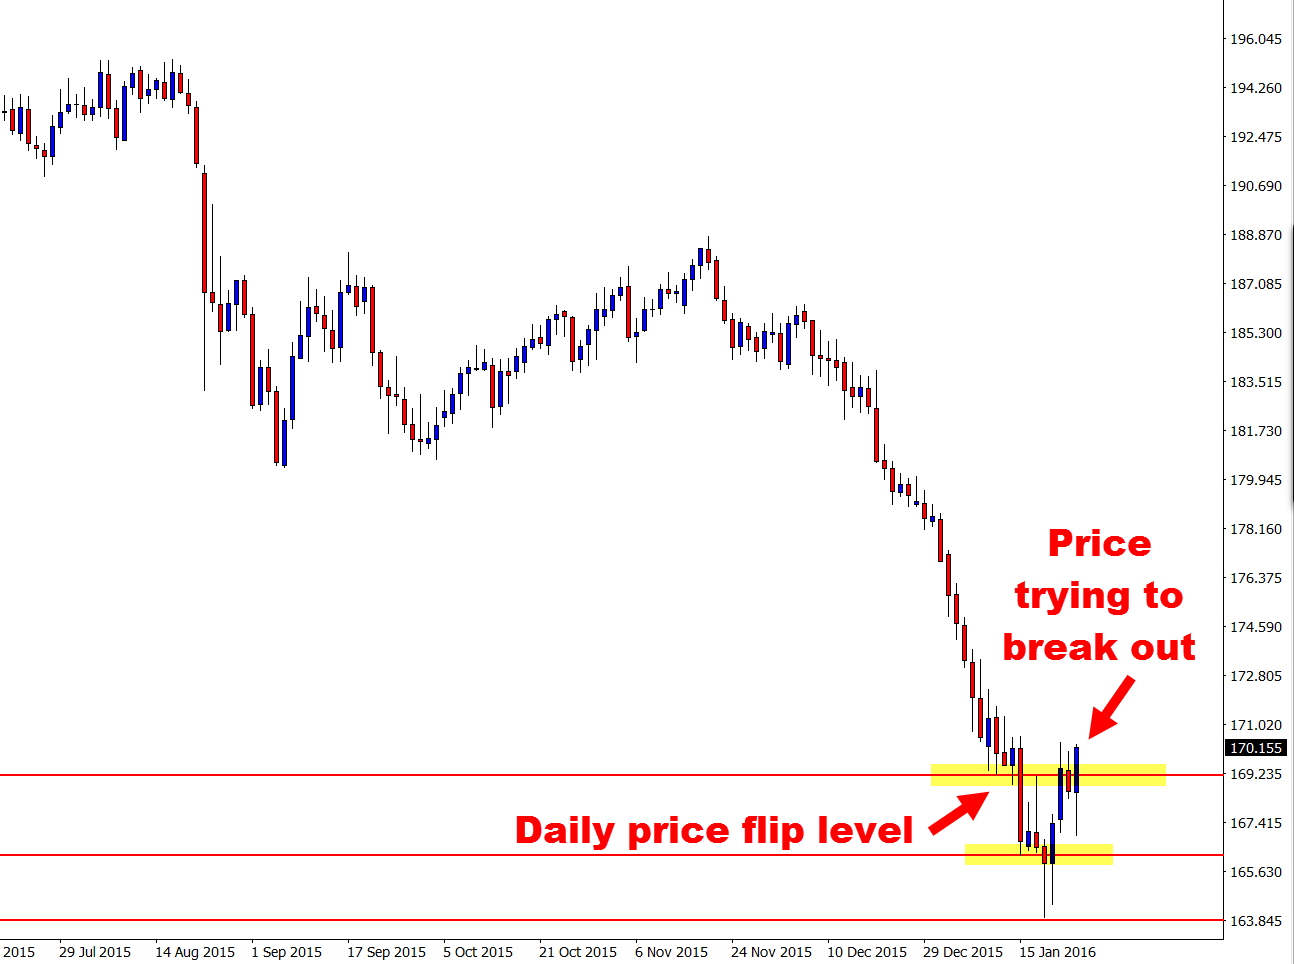
Price on the daily chart of the GBPJPY is as I write this for you trying to breakout higher and through the daily price action flip resistance area. Price has been unable in recent sessions to breakout and continue on higher with a sustained move, but as I write this price is strongly above and forming a Bullish Engulfing Bar = BUEB on the daily chart.
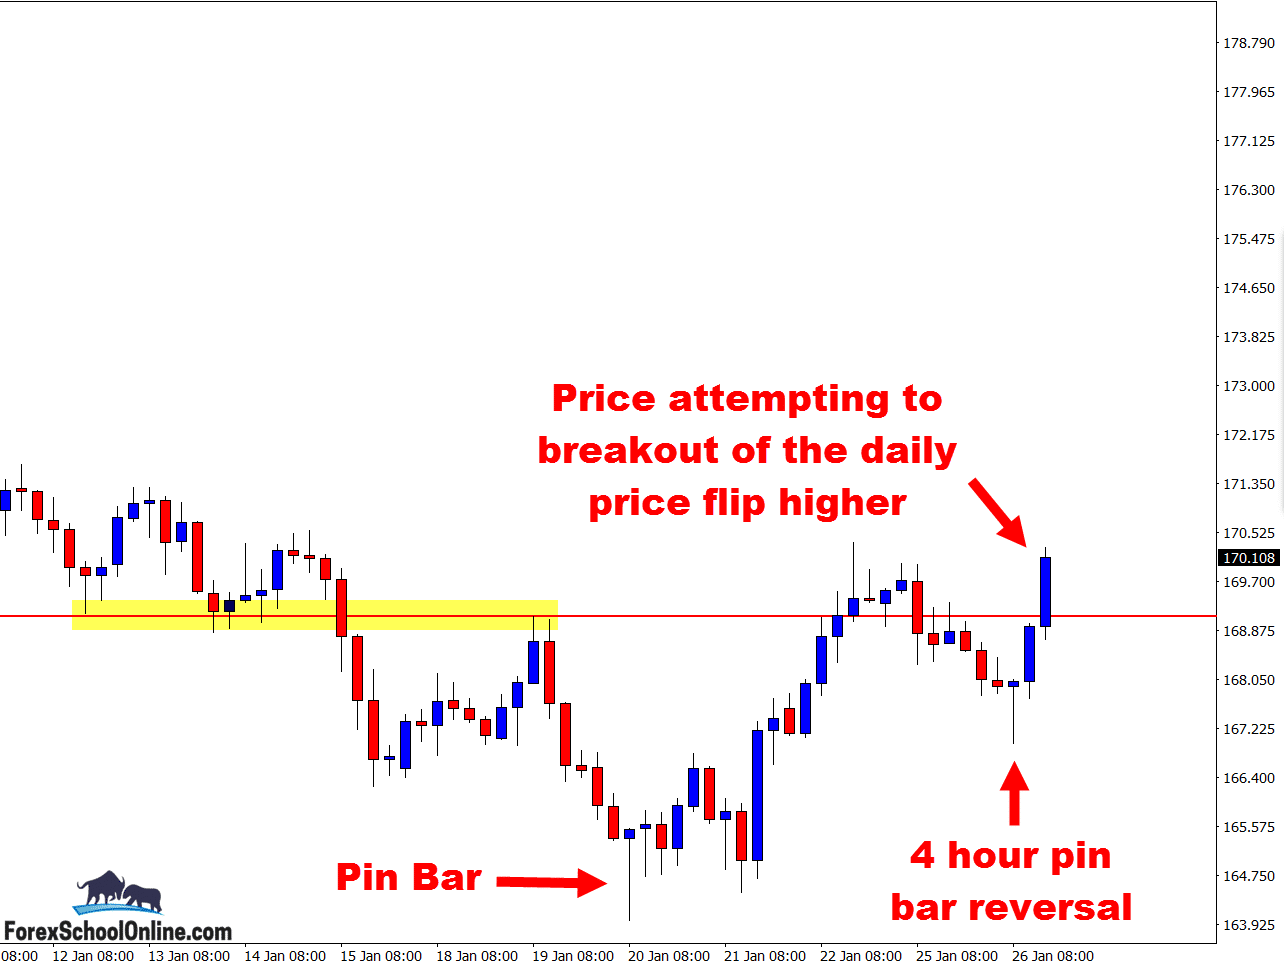
Price on the 4 hour chart of this pair has kicked off both the recent strong moves higher in recent times with strong, clear cut and aggressive Bullish Pin Bar Reversals.
As the 4 hour chart shows below; the first pin bar sent price from the extreme low back into the daily resistance and price flip level to make a major test and attempt at breaking through and back higher. Price failed and rotated back lower into the minor support level.
That is where you see price has formed the most recent pin bar reversal that I have marked on the 4 hour chart. This pin bar has kicked off the most recent move higher and the move that has sent price cracking higher and crashing through the daily resistance and looking to close above the major price flip level.
It is super important as to whether price does close above this price flip level or not. I go into a lot of depth as to how to trade these major levels and the secrets behind the price flip levels in the lesson at;
The Secrets Traders Can Learn From Candlesticks & Price Action
It is especially important in this case because this price flip is against a super strong daily trend. Just like I went through in last weeks lesson which I have linked to just below, we can often get into trends super early using this method because we are reading the very first signs of the trend changing and we are getting in on the ground floor if we do it right and listen and pay attention to the price action!
That lesson can be found at;
Anatomy of an Intraday Reversal on Crude Oil
Daily Chart – Price Flip
4 Hour Chart – Double Pin Bar Reversal

Related Forex Trading Education


Leave a Reply