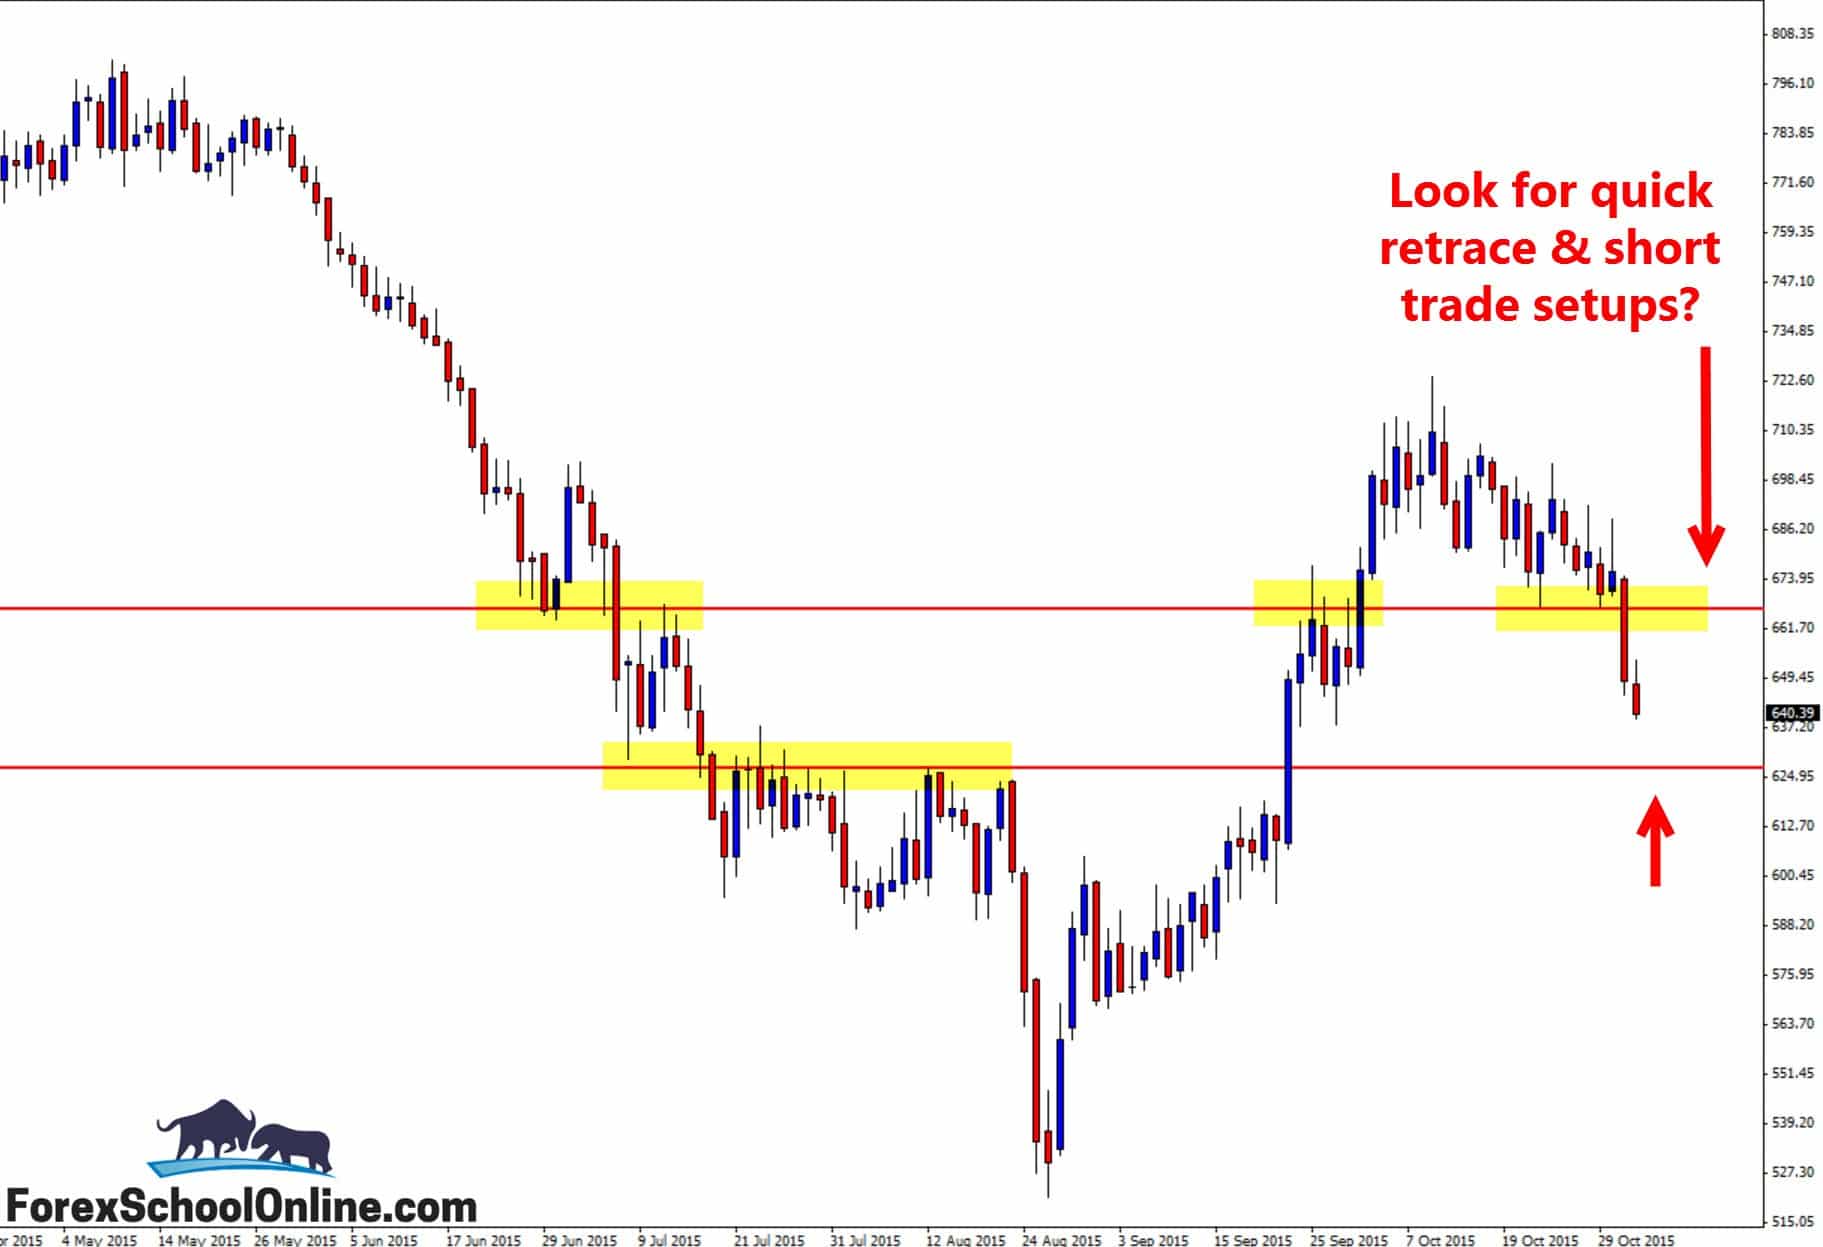
Price has smashed lower over the last couple of sessions to burst through the major support level on the daily price action chart of the Palladium market. Price had been holding steadily above what had been a strong “price flip” level until price then gave way and smashed lower with a strong and aggressive break below.
This strong break and move below now creates potential trading opportunities that I am keen to explore. Firstly, when a move like this happens and a really major level or more importantly, a “price flip” area is broken, price will very often make a retrace back into it to make a re-test.
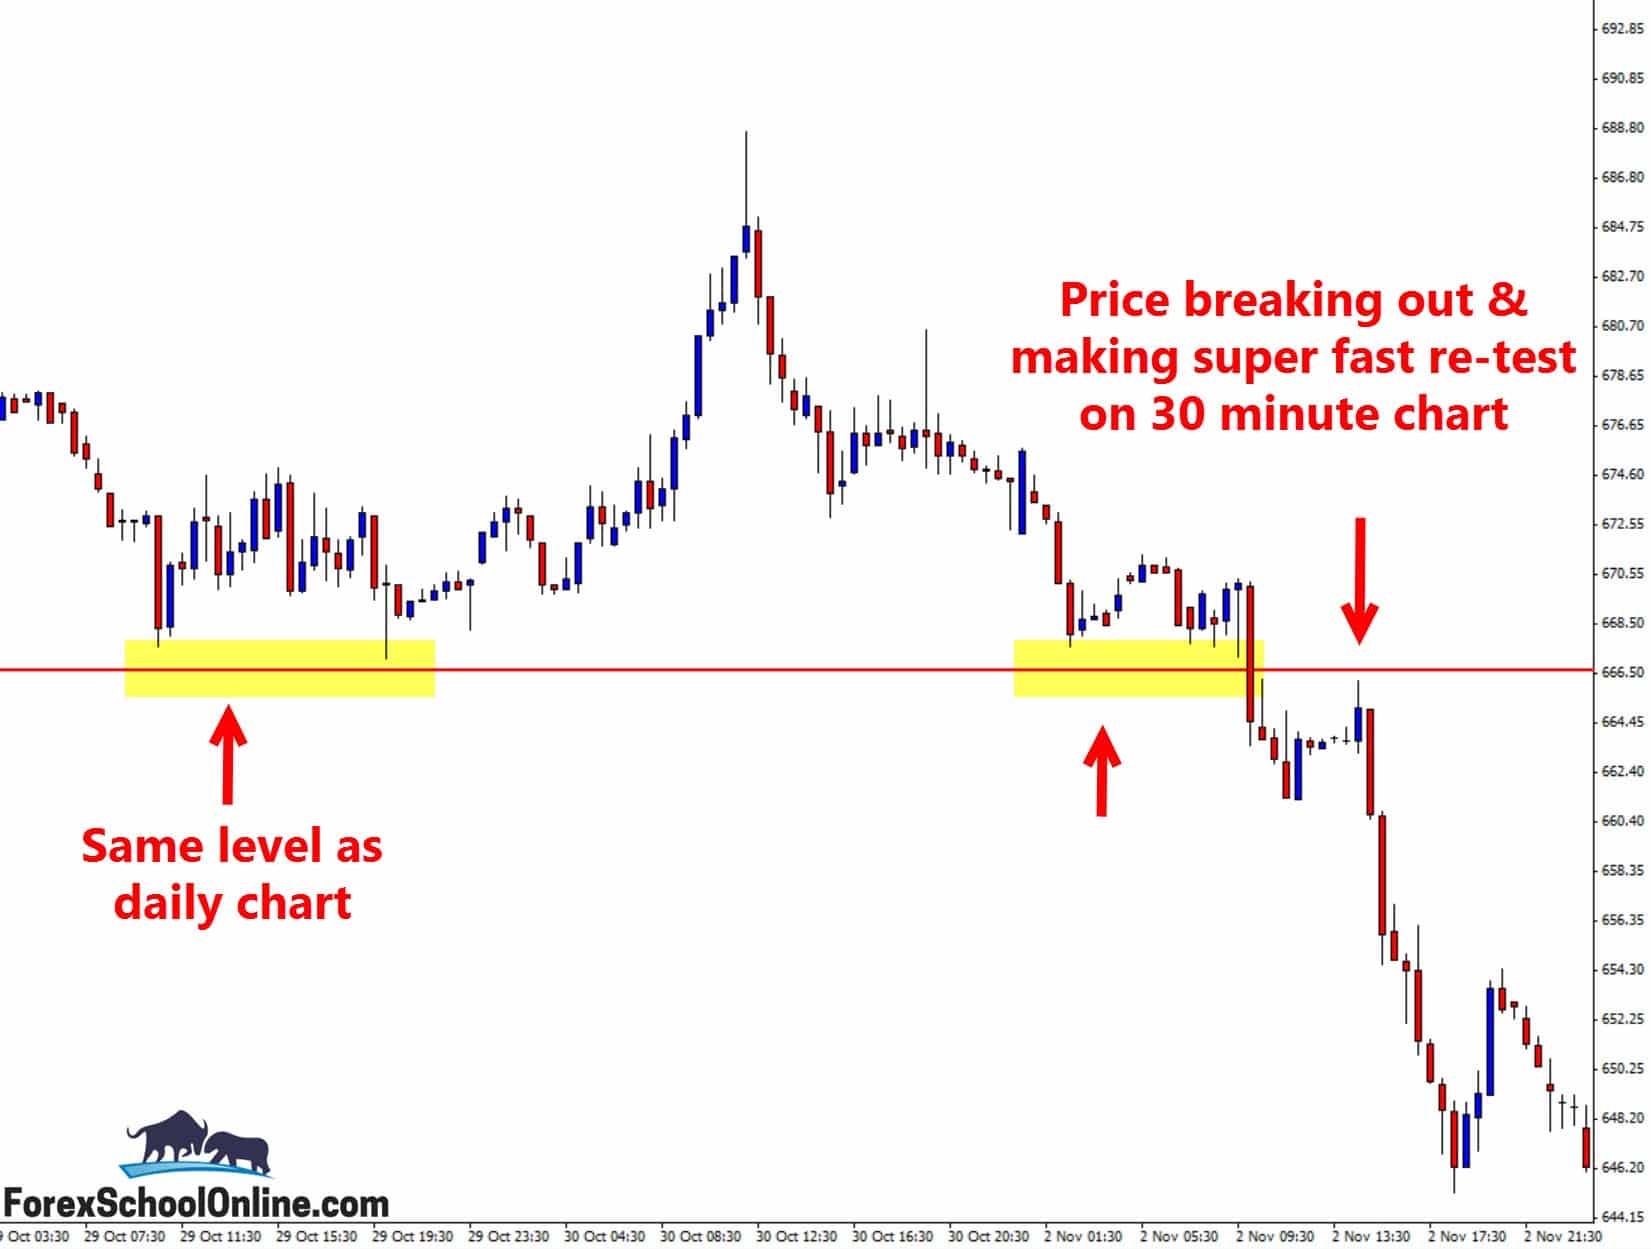
This re-test will often happen on the intraday charts and you often have to be quick; otherwise, you will miss it. Below, I have attached the 30 minute chart showing how price made this re-test of the same daily area that price broke out of.
So, just to quickly recap this part because this is important and this is something people often miss, price breaks out of a major daily area or price flip area. When this starts to happen, we then straight away start to go to our intraday charts and we start to see if price is moving back into this same level to make a “Re-Test” to look for potential trade entries. What we are trying to do here is get into what I call the First Test Strategy, and you can read how I set this up here:
Using the First Set of Support & Resistance Trade Strategy
Now, the next thing is that when price breaks lower and through a major price flip or support like it has here, it creates a lot of momentum on the smaller charts. For example, look at my daily chart below; there is no momentum or trend, right? Right, but look at my 30 minute chart below: there is a huge amount of momentum lower isn’t there? And, that is because this huge break of the support levels created it.
That brings us to what we can do in this market now. We have missed the first re-test. We need to keep that strategy in mind for Ron (Later-Ron). We can still trade with the momentum in our favor and from the major price flip though. We need to watch the price action behavior from here and, if price does make any rotations back into the old breakout level, we can look for potential short trade setups. Any short trades would need to be confirmed with high probability price action trigger signals like the ones taught in the Forex School Online Course.
If price keeps going lower, then as you can see on the daily chart below, the near term support is not far away and could be a level of interest to keep a close eye on.
Daily Chart – Major price flip
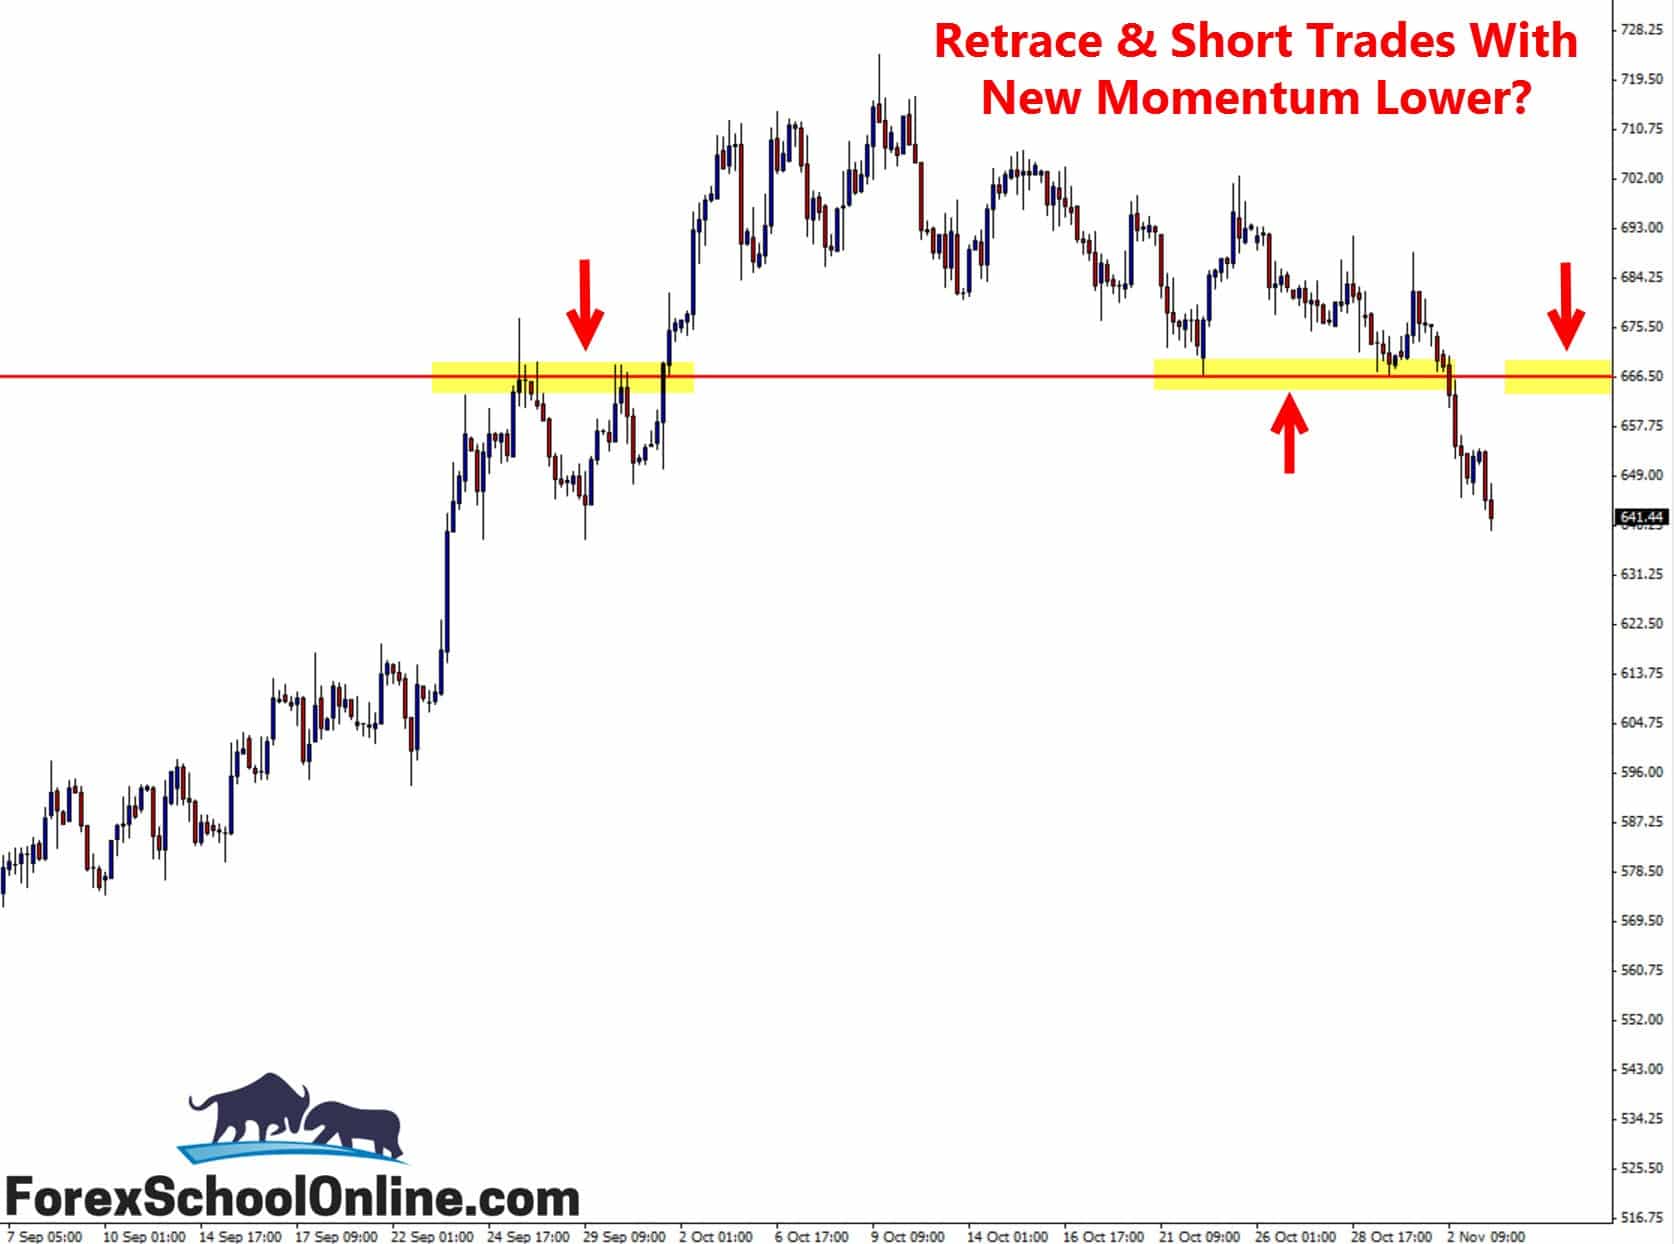
4 Hour Chart – Hunt short trade setups?
30 Minute Chart – First re-test on 30 min chart


Hello Johnathan
I have a small question about re test strategy, my question is related to that of 30 min chart above.
I want to know if we still take the trade if after the breakthrough the support and price move back higher but did not touch the old support now new resistant like the one on the 30 min chart above.
Senzo
Hi Senzo,
these levels are just that ‘levels’ or zones. If you zoom this level out further and you will see that it goes back much further.
The 30 min chart above is only showing the most recent snapshot and not the full picture of the daily chart level. It is only showing a very small amount of time of the daily level.
Whether you would take a trade at this area is completely up to your decision.
Johnathon
Hello john
ok I get you ,thank you so much.
senzo