Palladium
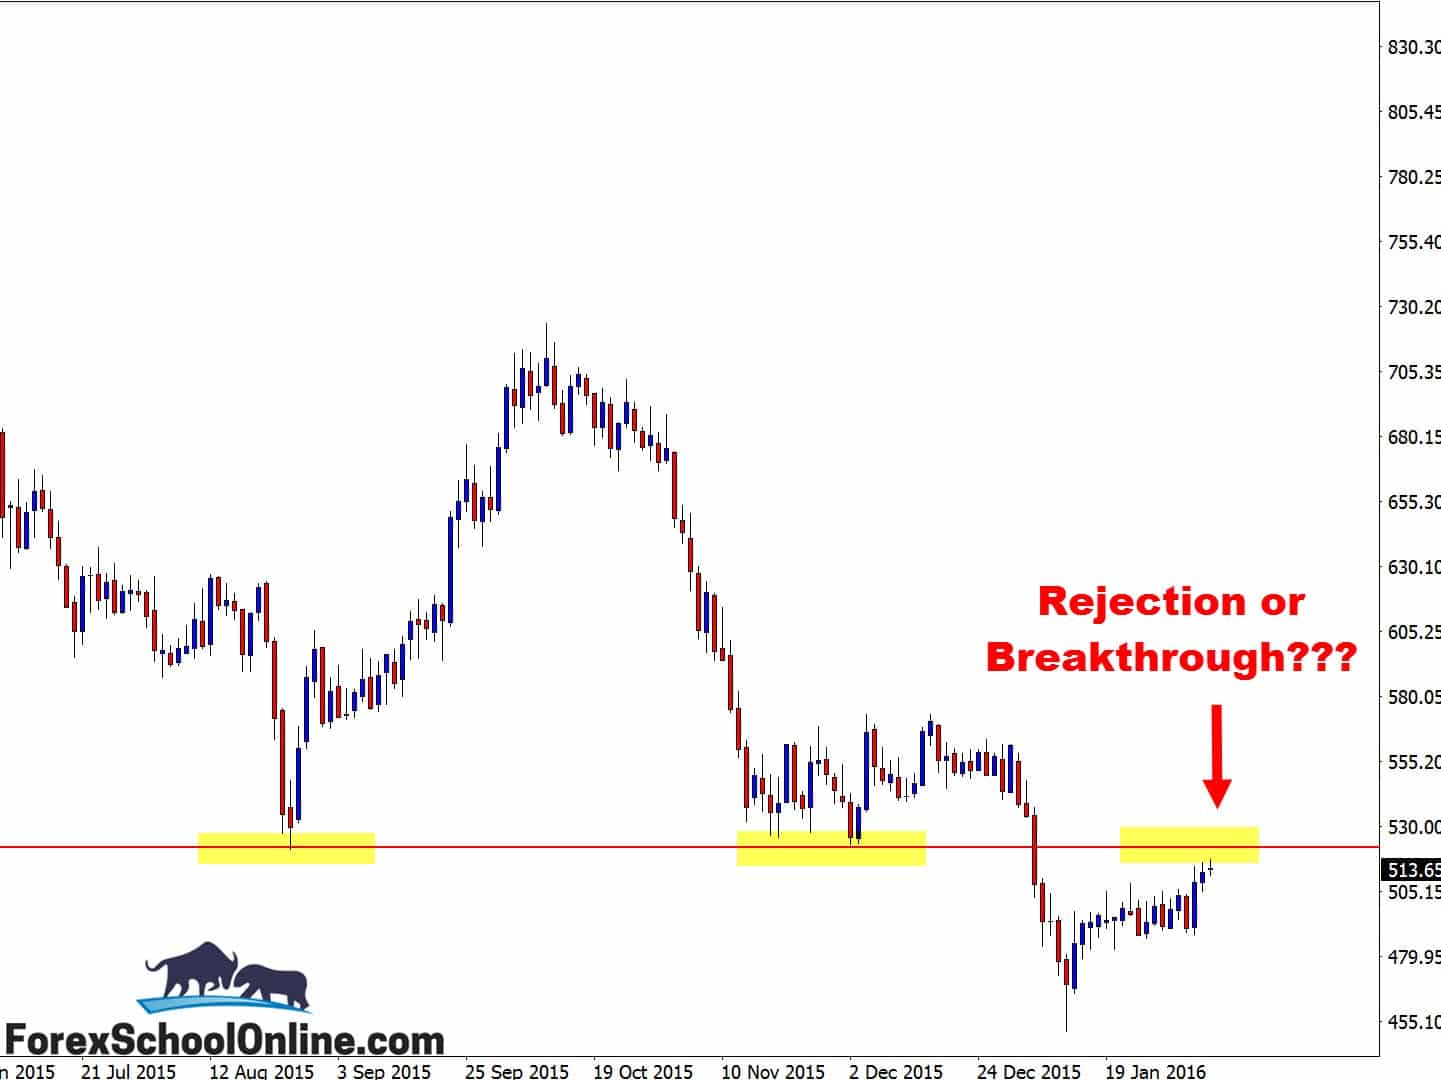
Price as I write this Daily Forex Trading Summary is moving higher and into a major daily chart resistance level on the Palladium v USD or XPDUSD chart. This level is a really key level in this market that only in recent times was a major support level holding price from moving lower.
Now that price is below and looking to touch the same level again, all eyes will be on it to see whether the level holds as a new price flip and an old resistance/new support level.
This level could potentially be a high probability level to look for bearish price action trigger signals. For any price action trades to be triggered we would need to see a bearish A+ trigger signal, just like the ones I teach members to make in the price action courses. The trigger signal would need to be up at the high, sticking out and rejecting the major resistance.
You can read more about why making reversals in the correct area is just SO, SO important in the trading lesson;
Making Money With Price Action Reversal Trigger Signals
Daily Chart

Platinum
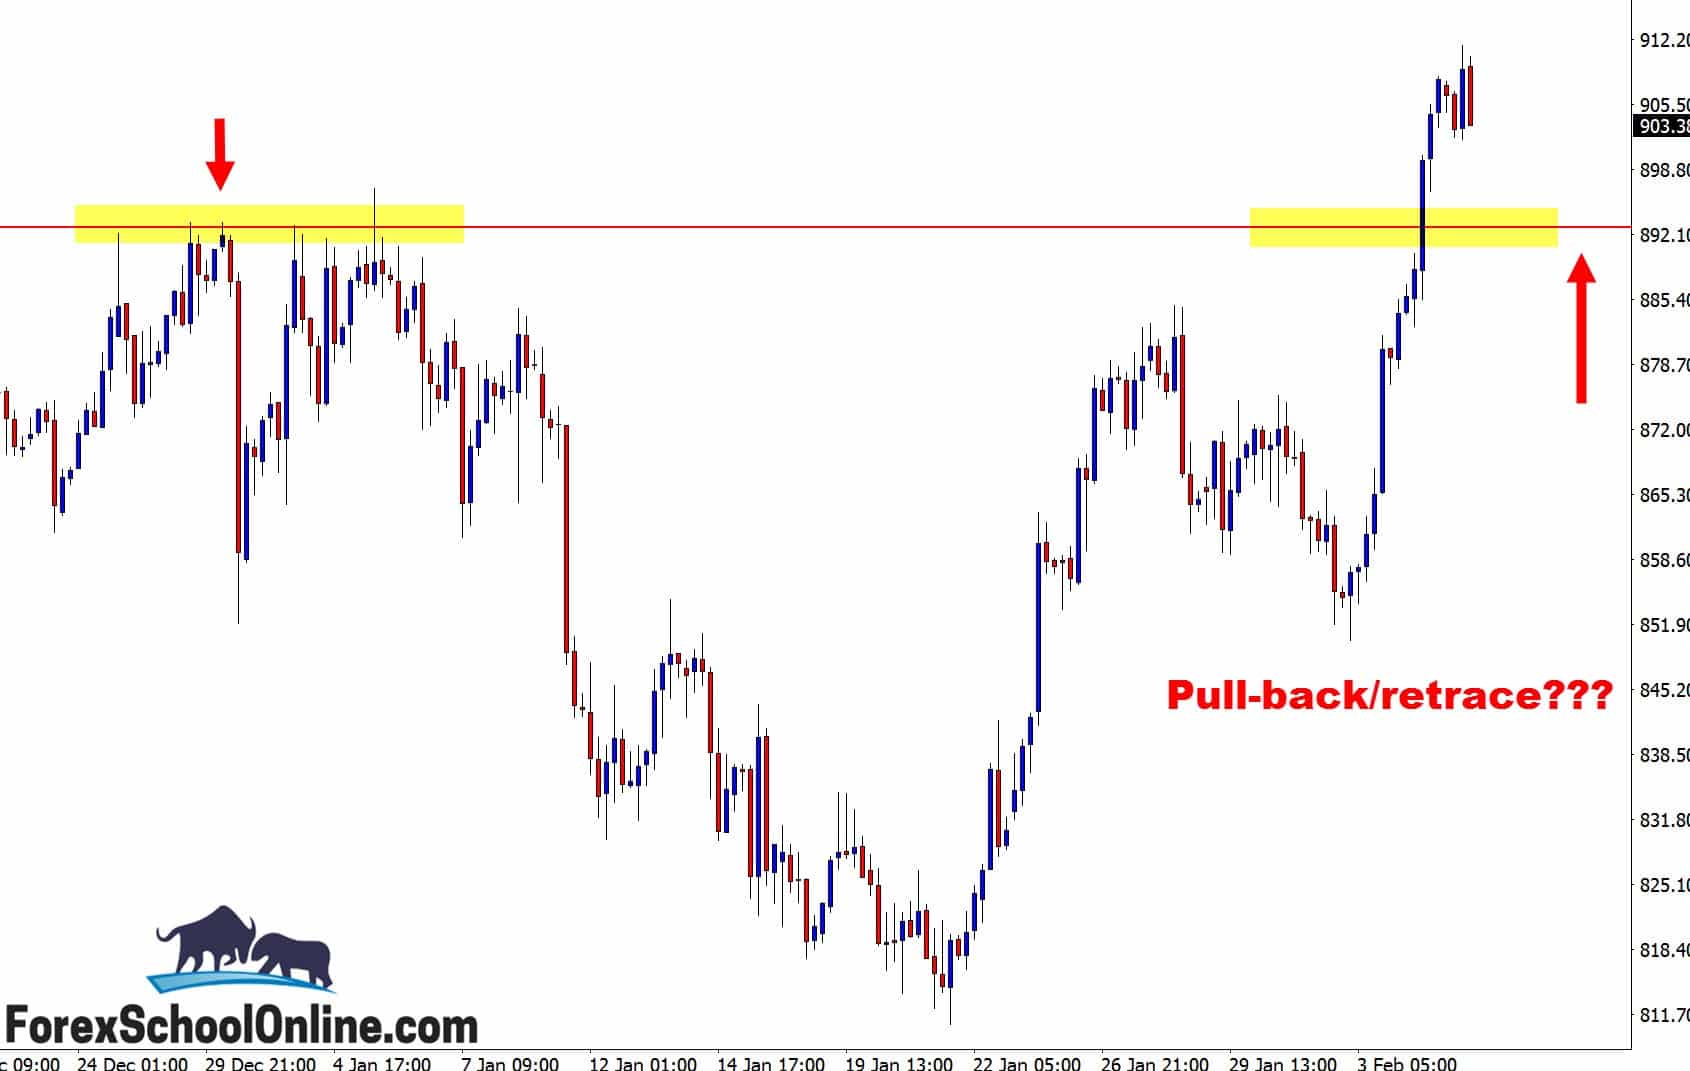
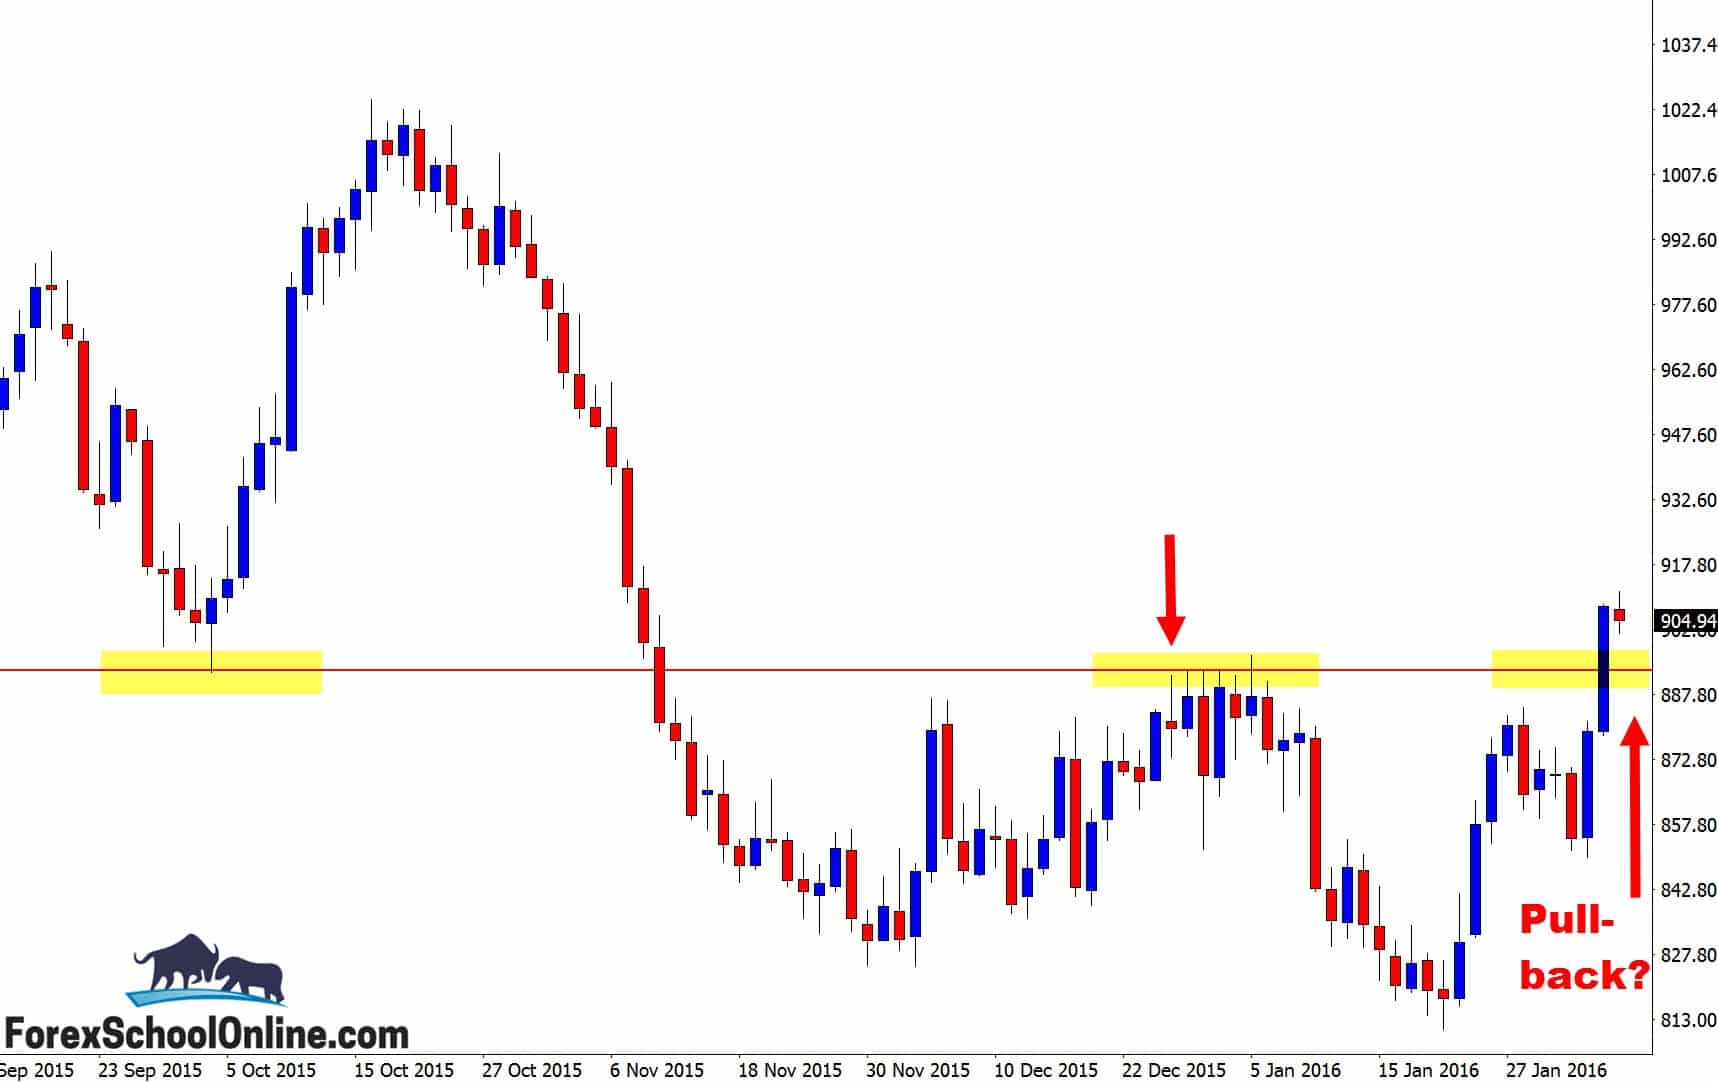
Price in yesterday’s session has broken up higher and through a major daily resistance level with a very aggressive and bullish move. This bust out was a very strong move higher with price closing strongly and right up near the top of the candle showing that price was bullish when it closed.
Can price now make a really quick pull-back or retrace into the old resistance and new support level? Price action traders could begin to move onto their smaller time frame charts to look for this move back into the new support level and to see if there is a potential to get long.
See the charts below;
Daily Chart
4 Hour Chart

Related Forex Trading Education


Leave a Reply