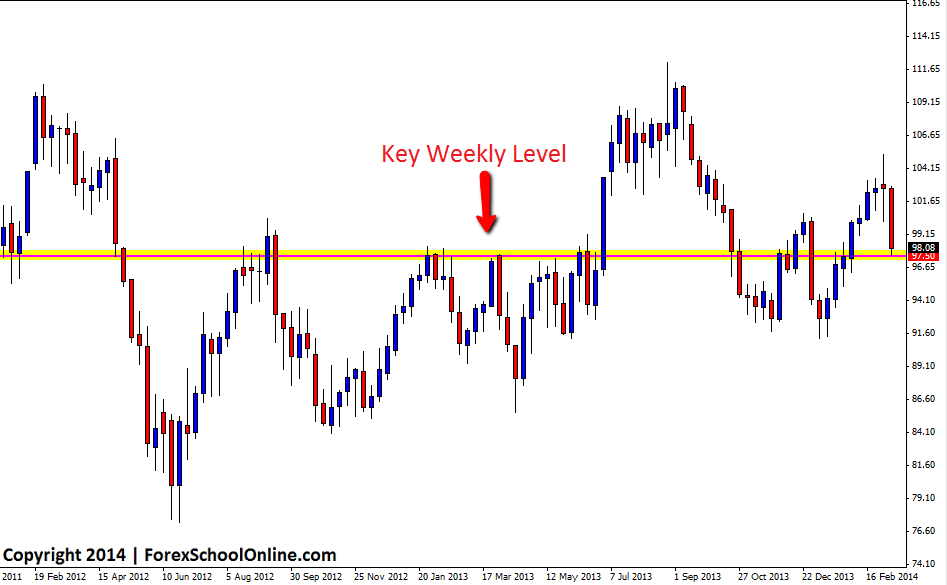
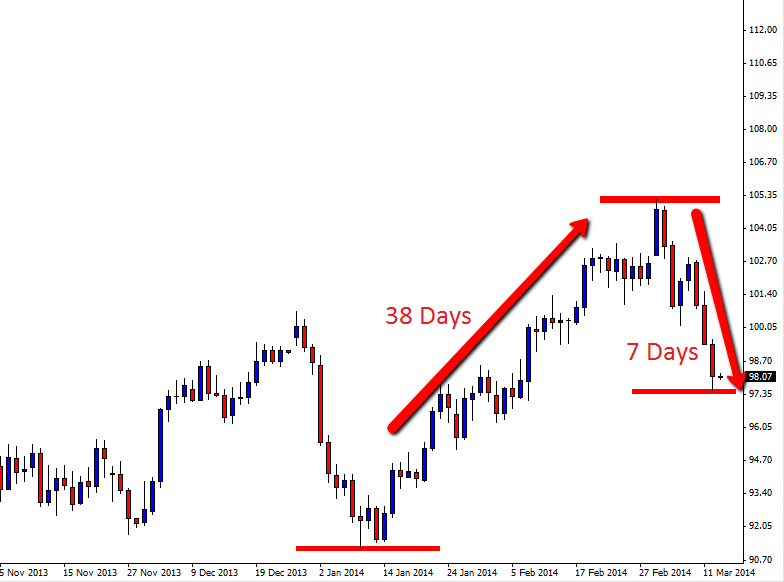
Price on the Oil (OILvUSD) daily price action chart has slammed lower into the 50% Fibonacci level after making a large run higher in recent times. After making a sustained run higher, price made a bearish 2 bar reversal that was rejecting resistance and once price started a move lower the move has been severe.
The run higher took 38 days for the bulls to grind price from the low up to the high of the 2 bar reversal. Then, the move lower from the high of the 2 bar reversal to where price is now erased half of all these gains in just seven days, which just goes to show how severe this latest sell off has been on the daily oil chart. Price will often sell off and move lower quicker than what it moves higher, as it has done here. The reason price can quite often sell off quite quickly is because a trend higher can often take time to build with buyers slowly coming into the market over time, but when something happens to scare the market, a heap of sellers can come in looking to get out of their trades all at once which can cause large sell off’s very quickly.
Price is now sitting just off the 50% Fibonacci level, however the down momentum as discussed above is very strong. 97.50 is a key weekly level that price is testing as of the time of writing this blog post and this level could prove crucial as to where price goes over the coming days and weeks. For traders watching this market, looking at the recent momentum and the strong level just discussed is key to where price goes in the near term.
OIL Weekly Chart

OIL Daily Chart


Leave a Reply