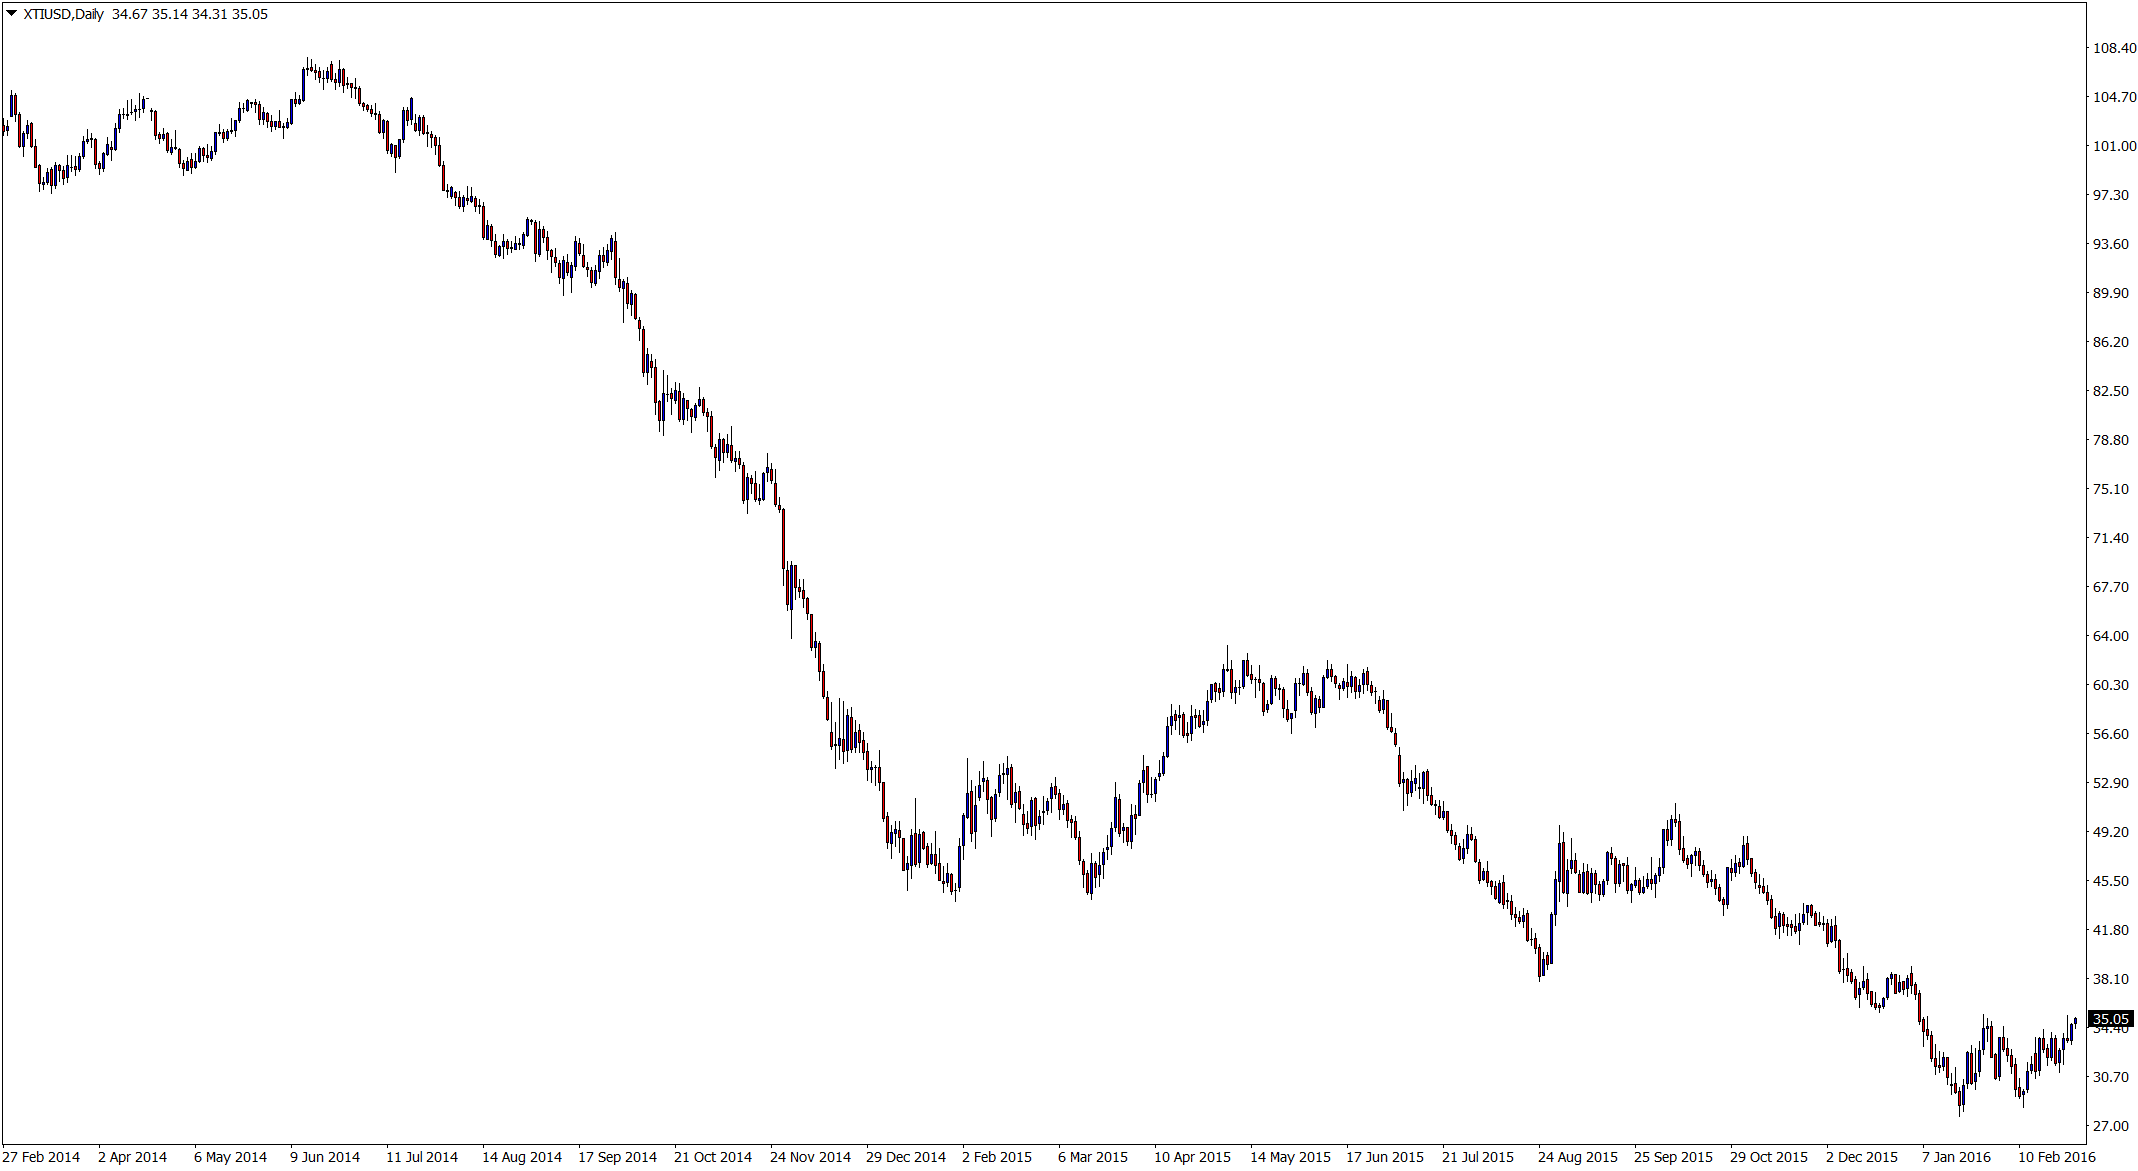
Unless you have been hiding underneath a rock and that rock has been in the middle of a desert far from anything, then you are well aware that the price of Oil has been smashed over the last two years. Just in recent weeks price has gone as low as to test prices that have not been tested since 2003!
The zoomed out daily chart that I have first up below highlights this thrashing of price best first you. As you can see on this chart; price does have moments where it pauses or trades sideways before then continuing with the super strong price action trend lower.
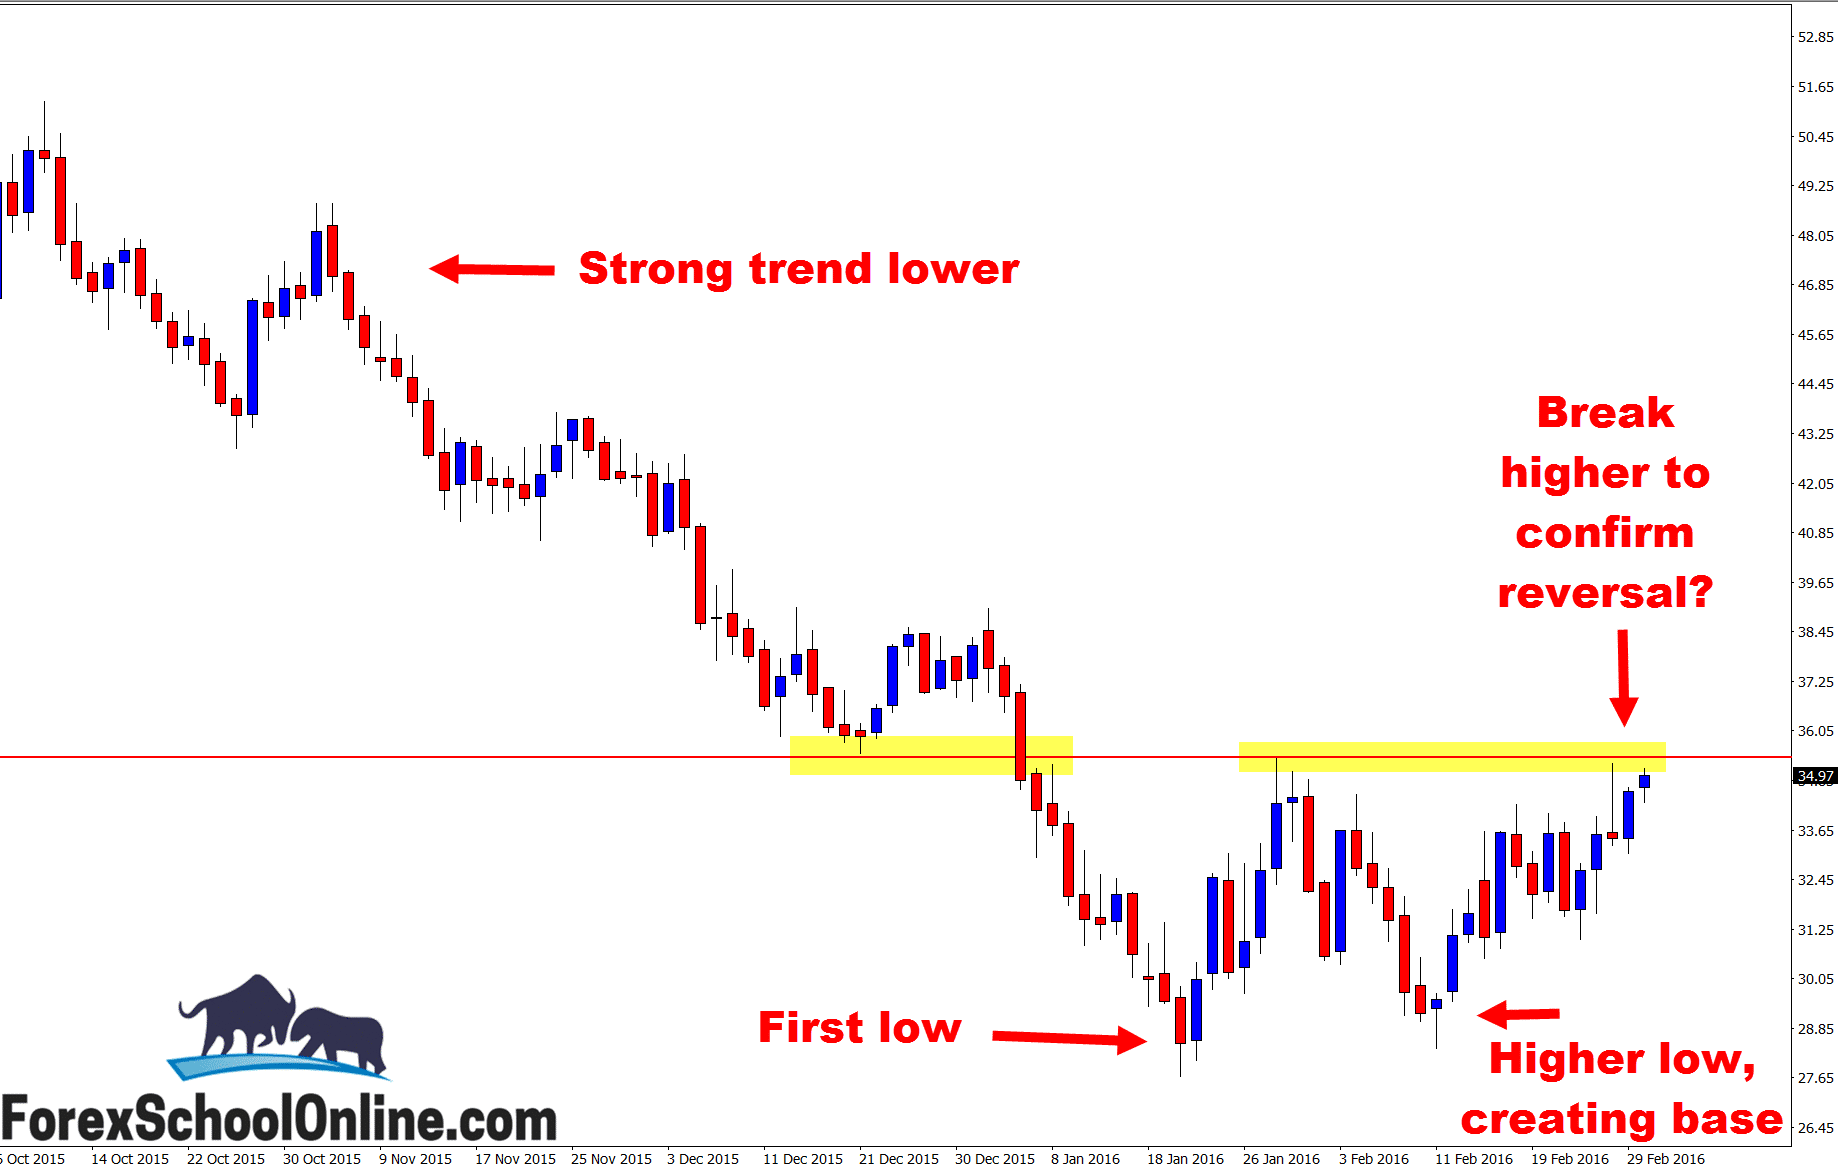
Price now is looking to make a potential reversal against this strong, aggressive and what has been persistent trend lower. We have the potential early price action signs of a base and reversal. Price has formed a base down at the extreme lows as shown on the chart below;
This is a super common price action order flow pattern when price is attempting to reverse against a strong move in the opposite direction. Price will rarely just make a reversal on a dime, or in other words; just make a reversal against a trend that is strong like this one, in just one candle.
What normally happens is, often there will be a struggle or multiple attempts for the trend to once again continue. You need to remember that the market is full of buyers and sellers. For a trend to change something has to change. In this case, the buyers have to take control and take command over the sellers or the bears who have been crushing it.
As the bulls are taking up their fight and making their move, the sellers/bears are not just going to roll over. They are not just going to give the bulls the keys to the kingdom and say “oh, here you go, here is all our gold, oh, and we leave our best beer out in the back mini fridge” right?
That’s why reversals rarely happen in one candle. Look at the chart below that has the illustration of the reversal on it. You will see that we have the first low, and then the bulls make a move higher. You will then see that we get another low.
The reason for this low is because of the bears or sellers. This is them trying to continue the trend lower. They are trying to fight the bulls off and continue the norm.
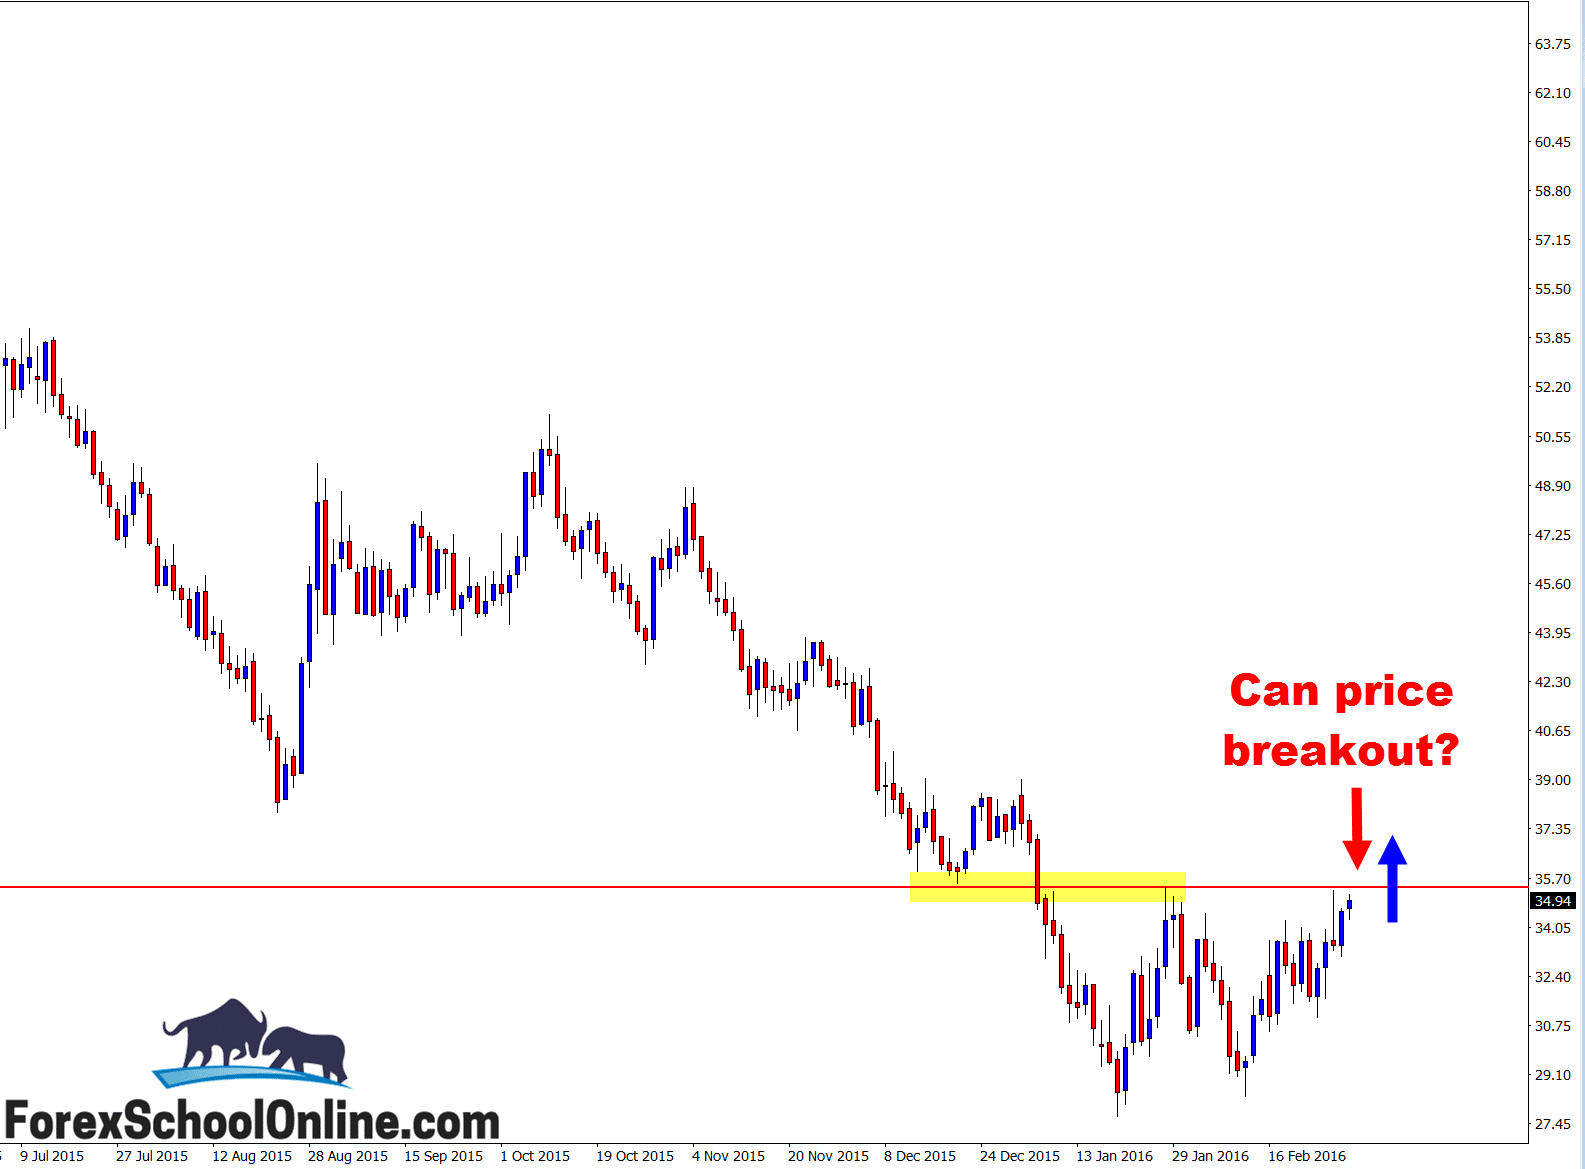
Where to from here? This major daily chart resistance where price is sitting at now is CRUCIAL. If price can breakout and close out, then it will confirm a 1,2,3 reversal pattern and a breakout. That will be really important for the bulls and also for momentum higher.
All of a sudden traders can start looking for breakout trades higher and ‘breakout and re-test’ trades into the old resistance and new support price flip, so that level becomes MASSIVE for this market.
Keep a close eye in the coming sessions on the price action behavior around that level.
Daily Chart – Zoomed Out – Strong Trend Smashes Lower
Daily Chart – Can Price Breakout?
Daily Chart – Price Creating a Base and Higher Low

Related Forex Trading Education


Leave a Reply