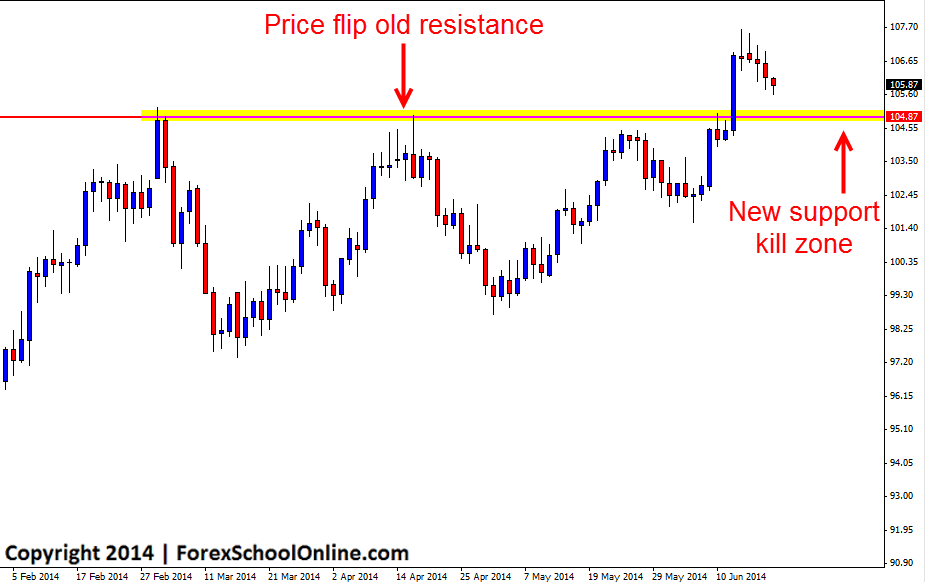
Price on the price action daily chart of Oil (WTI v USD) has recently broken out and is now looking to retrace into a potential kill zone. After breaking out of what was a really solid resistance level, price made a solid run higher before firing off a small bearish rejection candle. Price is now retracing back lower and if it continues, it may test the old resistance level.
If price does move lower to test the old resistance level. the level may look to hold as a price flip level and a new support level. These price flip levels can often act as high probability levels to look for price action trades and as I discuss in the trading lesson Taking Price Action Setups From Kill Zones when also trading with the recent momentum like would be the case here if price forms a bullish trigger signal, the probabilities are increased again.
To confirm any potential trades at this kill zone, price would have to form an A+ trigger signal like the setups taught in the Forex School Online Price Action Courses.
Oil Daily Chart


Leave a Reply