CADJPY Daily Chart
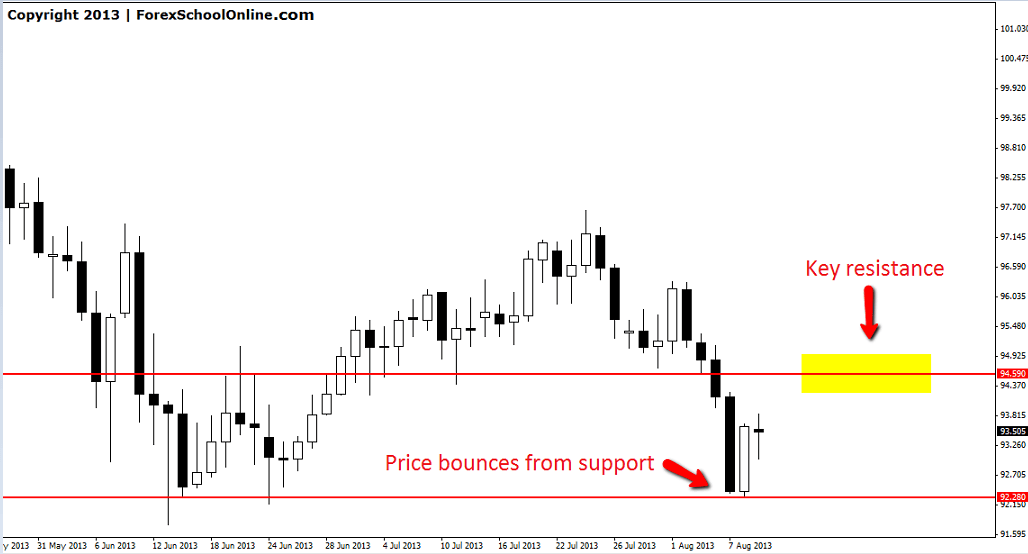
Price on the CADJPY is not in a clear trend in either direction higher or lower with price ranging between key support and resistance levels on the daily chart. Price has been moving down lower in the very short term with the momentum to the downside, but the overall feeling of the market is sideways trading. Price in the last week has hit a major support level and found some buyers at this level which has caused price to bounce from this level.
Price is now moving higher and into a key resistance zone where traders could look for possible bearish price action to make short trades. This resistance area could act as a high probability area to get short should the right price action present. It is very important that the right price action does present at this level and that traders don’t just jump the gun and enter a trade without the price action signal for confirmation. This is why we spend so much time writing articles and videos here at Forex School Online on price action signals to help traders because it is the price action signal that shows the trader what the market is doing and the clues as to where the market wants to go. We can see from the price action signal whether the level is looking to hold and we should be entering a trade, or whether the resistance level has been broken and we need to be sitting on the sidelines and letting the trade pass.
CADJPY DAILY CHART | 11 AUGUST 2013

OIL 8hr Chart
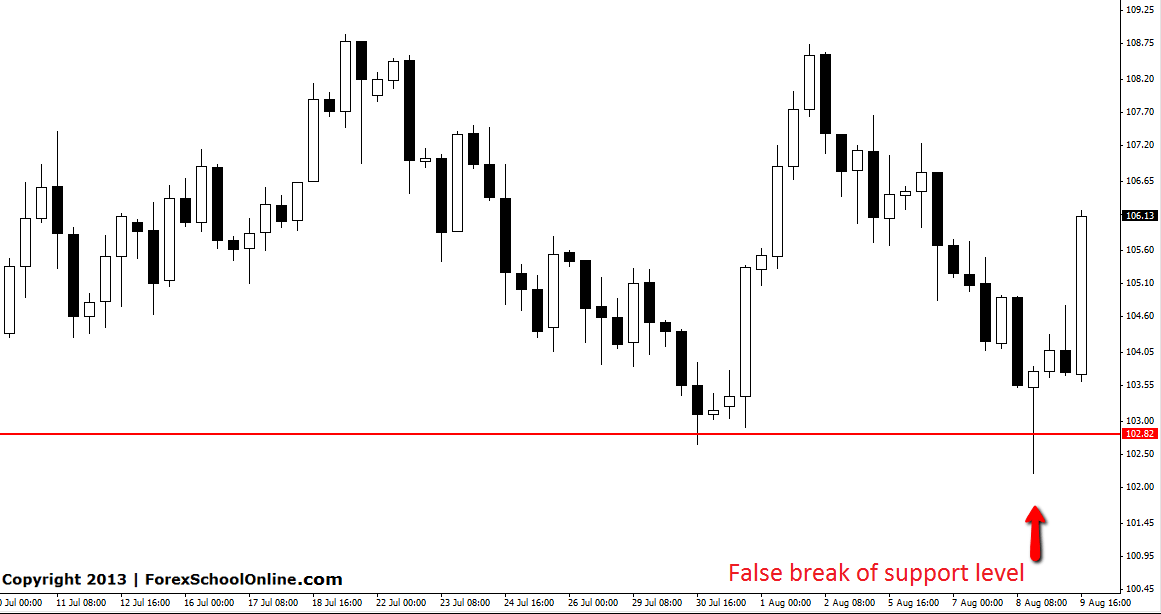
At the end of last week, price on the Oil chart moved down to test the major support level. Price moved lower and created a huge false break which ended in a large perfect A++ Pin Bar reversal. This was a textbook Pin Bar and I wanted to highlight this setup as a textbook false break Pin Bar setup for traders to take note of. The false break setup is a high probability setup that when played from the correct areas on the chart has a very high win rate. This Pin Bar is a textbook setup because it sticks out and away from all other price, it is big and obvious, it has a large nose that is faking out the rest of the market and it is rejecting a key level which in this case is a major support level. Inexperienced traders should print a copy of this setup out and stick it next to their computer and burn it to their memory!
OILD 8HR CHART | 11 AUG 2013


I caught this trade, such a beauty. Thanks a bunch for your guidance