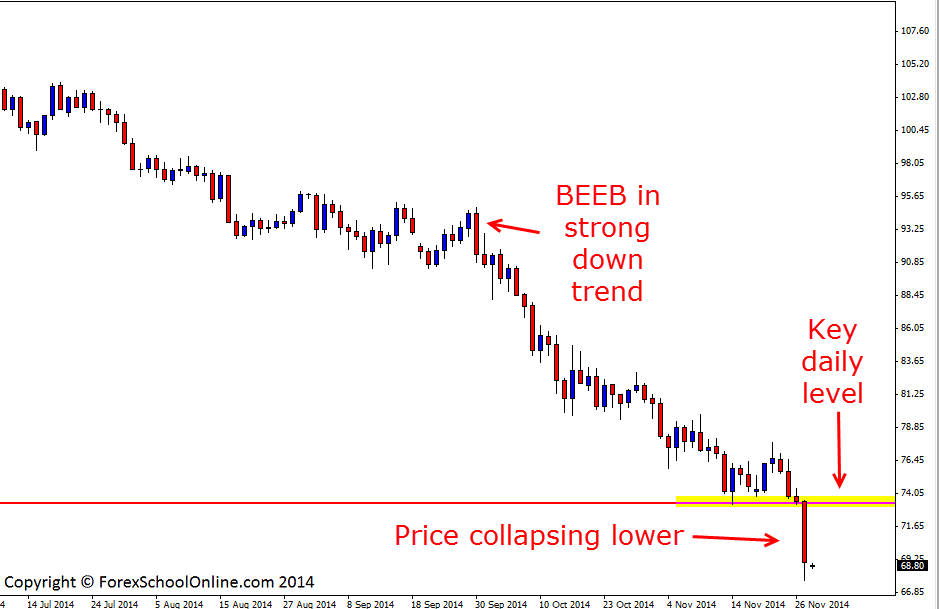
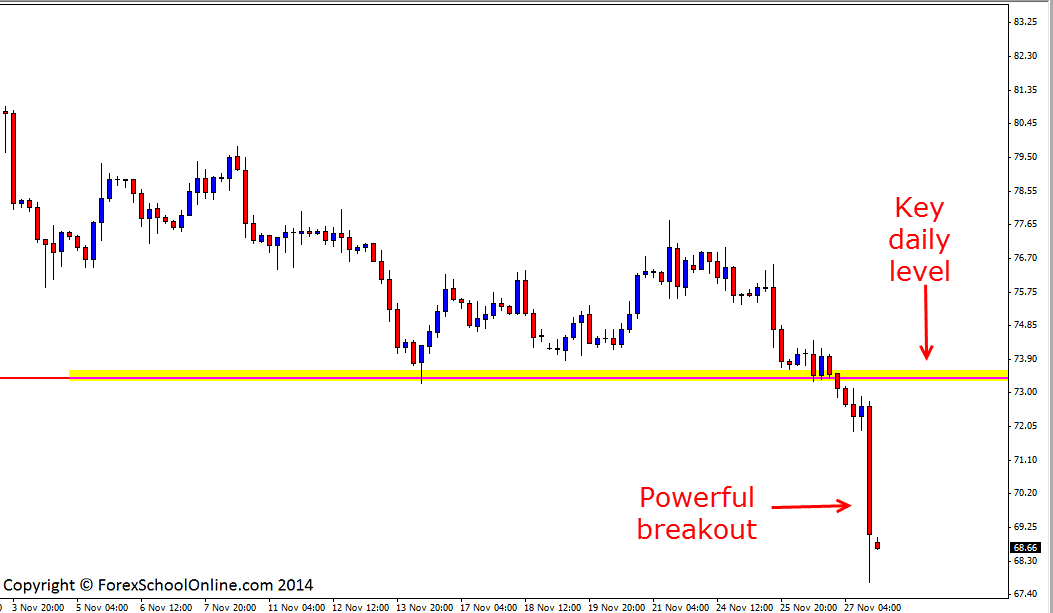
Price on the Oil (WTI v USD) has once again been crunched to fall lower and through the floor on the daily chart. Price is now falling to prices that have not been seen or even thought of in the recent four years, but with price now in such a strong down-trend who knows how far price may continue to move lower. The bears look firmly in control of this market and at this stage that does not look like letting up. The move and break through the support level was a very strong and aggressive one with price breaking and making a strong close lower.
As I discussed in the recent 11th Nov Daily Forex Commentary on West Texas Oil a huge mistake a lot of traders often make is trading with what they think, rather than what they are seeing and what is right in front of them in the price action and on their charts. At the moment the price action could not be any clearer. The trend is strong and until price begins to give clues that it is either reversing or forming a base, the highest probability play is to just continue trading with all the bears who are in control and not to try to fight against them and all their momentum.
As the charts shows below; if price can rotate higher either over the next day or days into the key daily level, then that level could look to become a key price action flip level and look to hold as a new resistance level within the strong trend and also be a solid area to hunt for short trades. This market has been making regular rotations and pullbacks higher with the trend lower to give traders a chance to get into trades with the trend. When the pullbacks occur you have to be on the ball and ready to pounce with either a setup on the daily or intraday charts because quite often price will rotate and fire off a trigger signal on an intraday chart rejecting the key daily level.
WTI Oil Daily Chart

WTI Oil 4 Hour Chart

Related Forex Trading Education


Leave a Reply