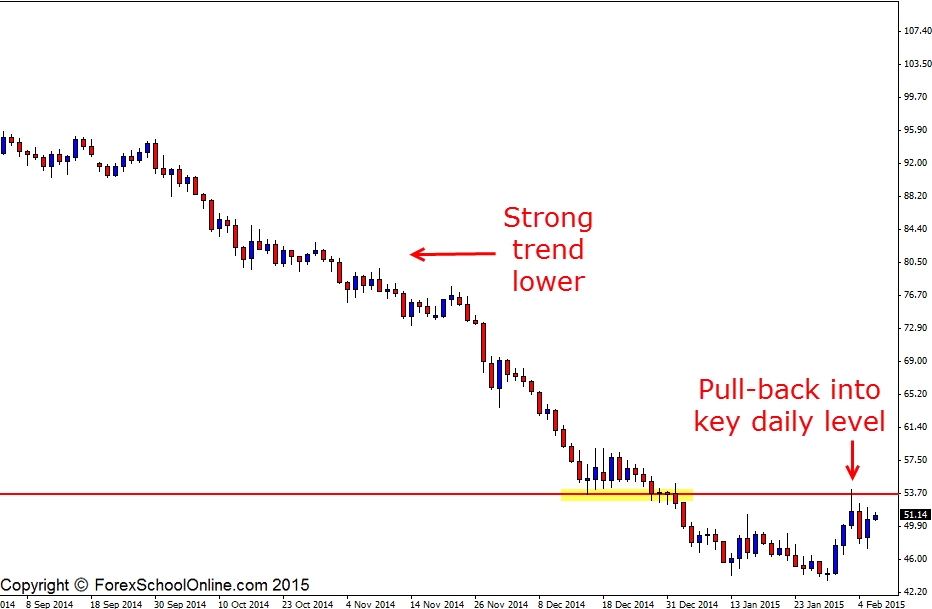
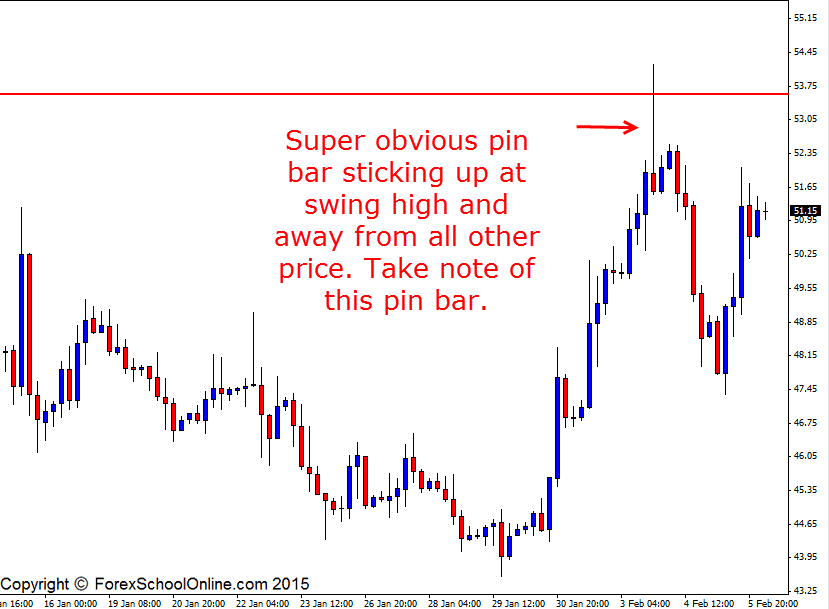
Oil (WTI) on the 4 hour chart has now dropped lower and made the swing into the next support that we suspected it may do after confirming and breaking the low of the 4 hour pin bar reversal it had formed earlier in the week. In the 4th Feb EURUSD Pin Bar Reversal Daily Forex Commentary Post I discussed how the Oil market had also formed a solid setup and how whilst the EURUSD setup had formed it’s setup during the Asian session which can always be a slight risk, the Oil market can be traded all day round.
What was important was that this pin bar was confirmed and that price broke the low of the pin bar on the 4 hour chart. What this does is if you have your entry under the low of the bearish pin bar, it means you are going to be doing a few things. First of all you are going to be trading with the momentum. When price breaks the low of the pin bar, price is going in your direction.
If you take a retrace entry, price is moving against you and you have to hope that something happens to turn price around in your direction. The other thing that happens when you take entry at the break is that you cut out all of the pin bars that never go on to confirm and go on to be losers.
In other words; when you take a retrace entry you are effectively ensuring you take every single losing pin bar, but when you take entry at the break with confirmation and with momentum, you are cutting out a heap of the losing trades that never go on to confirm.
Special Note: To add these markets to your trading list like Oil and other markets such as the major stocks indices for example; Dow Jones or FTSE etc, check out the correct New York close charts here;
Recommended Forex Broker & Charts For Price Action Traders
and always remember; please make sure you demo with any new markets you trade with first until profitable and comfortable.
Oil Daily Chart

Oil 4 Hour Chart

Related Forex Trading Education
– Why Your Habits Hold The Key to Your Forex Trading Success


Leave a Reply