Market Analysis: NZDUSD Bullish Reversal Pattern Signals Potential Upward Movement
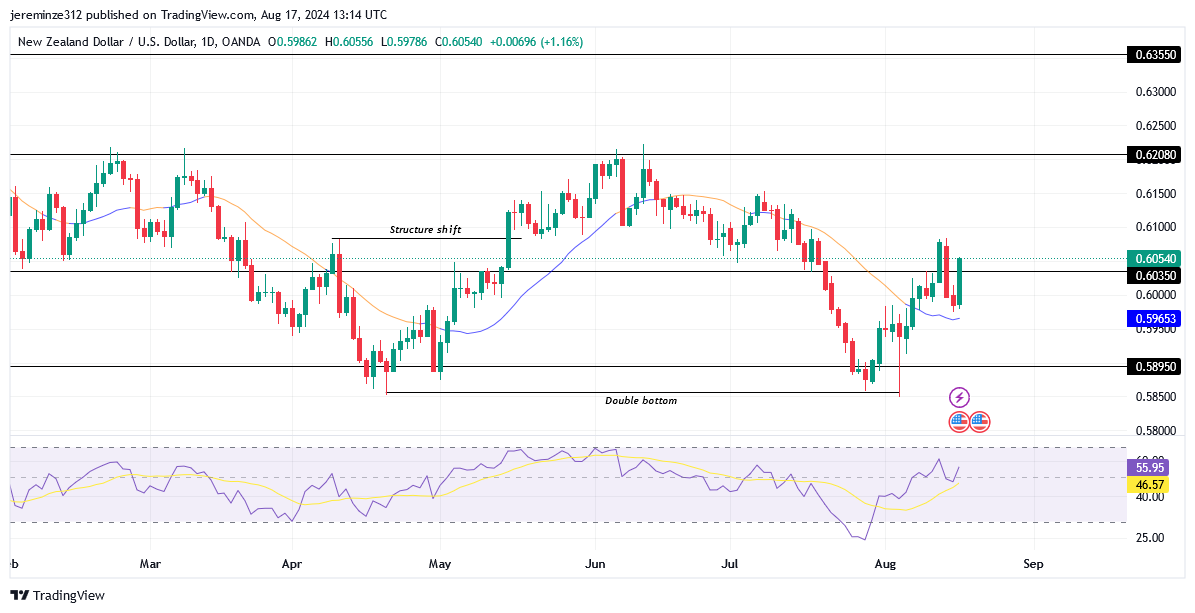
The NZDUSD pair has shown a significant bullish rejection from a critical support level at 0.58950, a point that previously triggered a bullish shift in the market structure in late May 2023. Despite this upward shift, the pair encountered strong resistance at the 0.62080 level, leading to a bearish retracement. However, the resilience of the 0.58950 support level held firm, as the currency pair did not fall below this threshold, emphasizing its importance.
NZDUSD Significant Zones
Resistance Levels: 0.62080, 0.63550
Support Levels: 0.60350, 0.58950
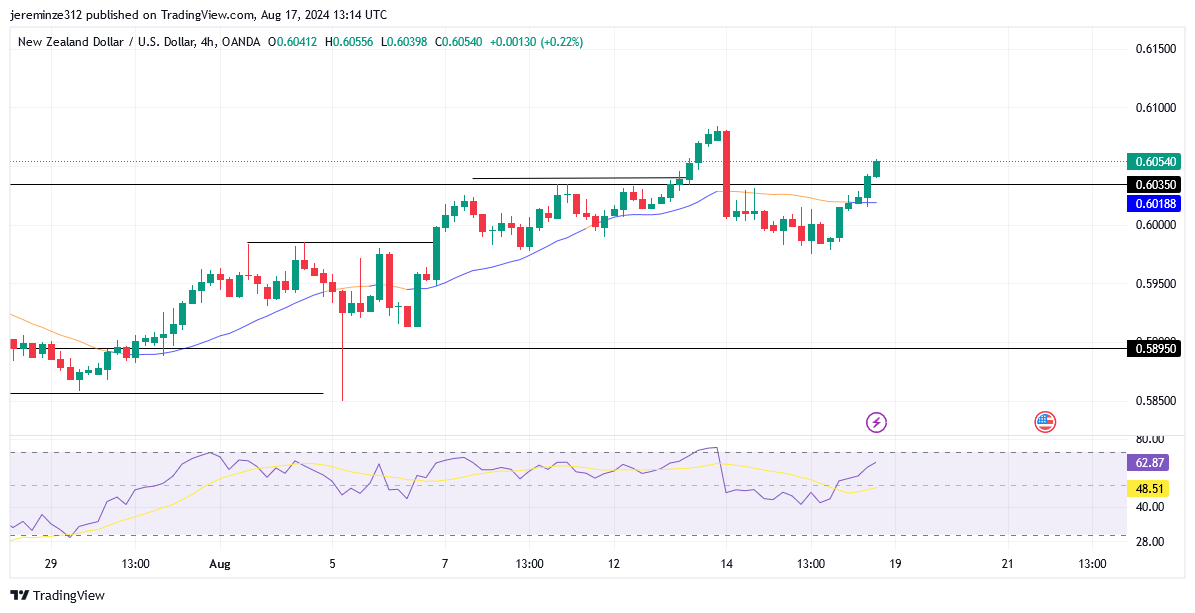
The strength of this support has led to the formation of a double bottom reversal pattern on the daily chart, a technical formation often linked with a shift in market sentiment from bearish to bullish. This pattern is accompanied by a surge in aggressive bullish momentum, evidenced by the formation of higher highs and higher lows on the 4-hour chart.
Adding to the bullish narrative is the behavior of the daily Moving Average, which has shifted from signaling bearish conditions to now flashing bullish signals as the NZDUSD price has moved above the Moving Average.

Market Expectation
Given these technical indicators, market sentiment is increasingly positive, and the expectation is that the bullish trend will continue. There is strong anticipation that the pair will not only test but also successfully break through the 0.62080 resistance level. After this potential breakout, the NZDUSD pair is projected to aim for the 0.63550 level next. These developments could provide valuable forex signals for traders looking to capitalize on this bullish momentum.
Note: Forexschoolonline.com is not a financial advisor. Do your research before investing your funds in any financial asset or presented product or event. We are not for your investing results.


Leave a Reply