NZDUSD Analysis – Price Trades at a Lower Level After It Drops Below 0.67140
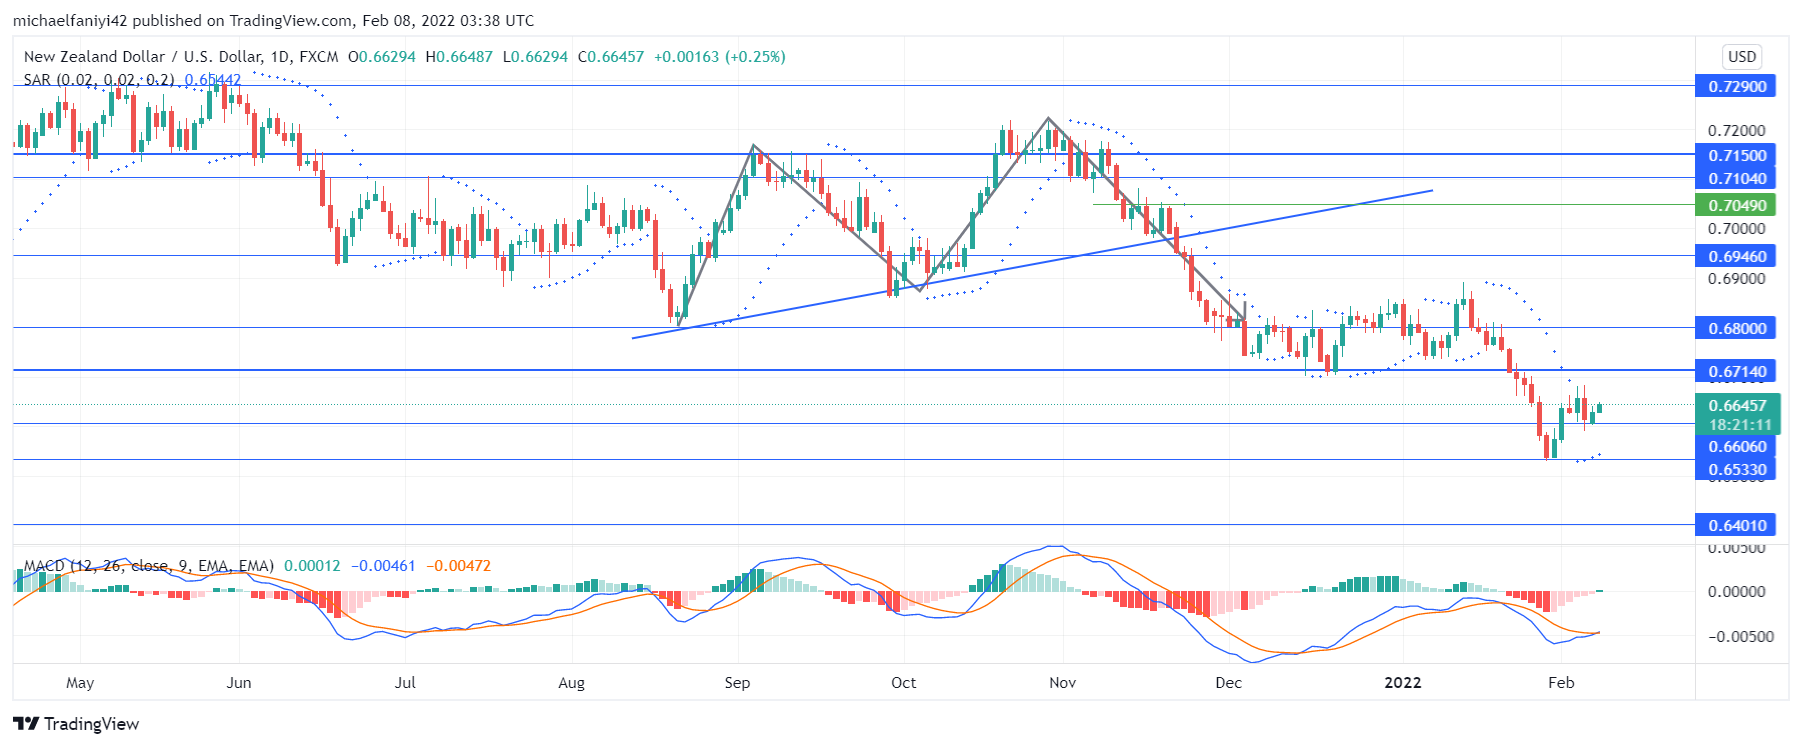
NZDUSD trades at a lower level after it fails to hold above the 0.67140 critical support level. The price dropped to the support level at the beginning of December 2021. Market purchasers were at a very low ebb as they struggled to lift the price from this level. NZDUSD struggled above this level for the rest of the year. Towards the end of January 2022, the price slumps and trades at a lower level at 0.65330.
NZDUSD Critical Zones
Supply Levels: 0.71500, 0.69460, 0.68000
Demand Levels: 0.67140, 0.66060, 0.65330 From mid-2021, NZDUSD can be seen to be trading generally in a sideways movement, with minimal interference. This continues till the market assumes a slanting double top formation. This swings the tide more in the sellers’ favor, as the price began a swift descent after breaking the neckline of the double top formation.
The price, therefore, crashed to the support level at 0.67140. The pressure continued mounting on the price level and soon enough it yielded as the price trades lower. At 0.65330, buyers have begun to regain themselves and there is a reaction that lifts the price at a level above 0.66060. The Parabolic SAR (Stop and Reverse) suggests we will see more upside movement. The Moving Average Convergence Divergence) has made a golden cross from a bearish position.
 Market Expectations
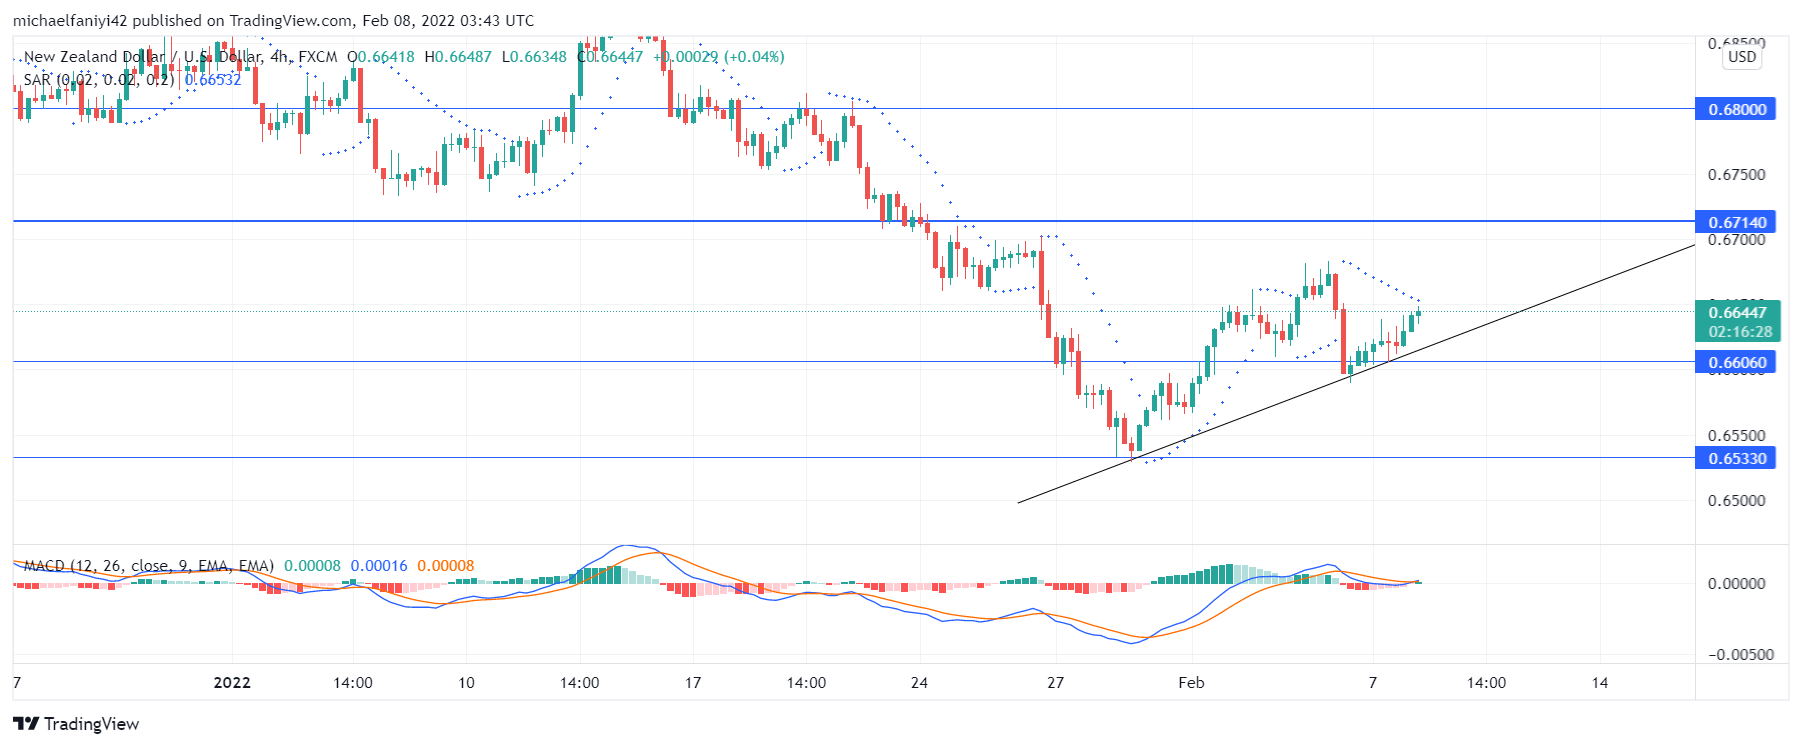
On the 4-hour chart, the price is seen gliding up a trend line. This keeps edging it closer back to the price level from where it dropped. The MACD indicator has risen slightly above the zero level in this time frame. A cross at the tip of the line also suggests that the price currently trades in an upward direction. We expect the market to rise to 0.67140 and break it as the bulls regain themselves.
Note: Forexschoolonline.com is not a financial advisor. Do your research before investing your funds in any financial asset or presented product or event. We are not responsible for your investing results.


Leave a Reply