NZDUSD Analysis: Temporary Upsurge Amidst Bearish Trend
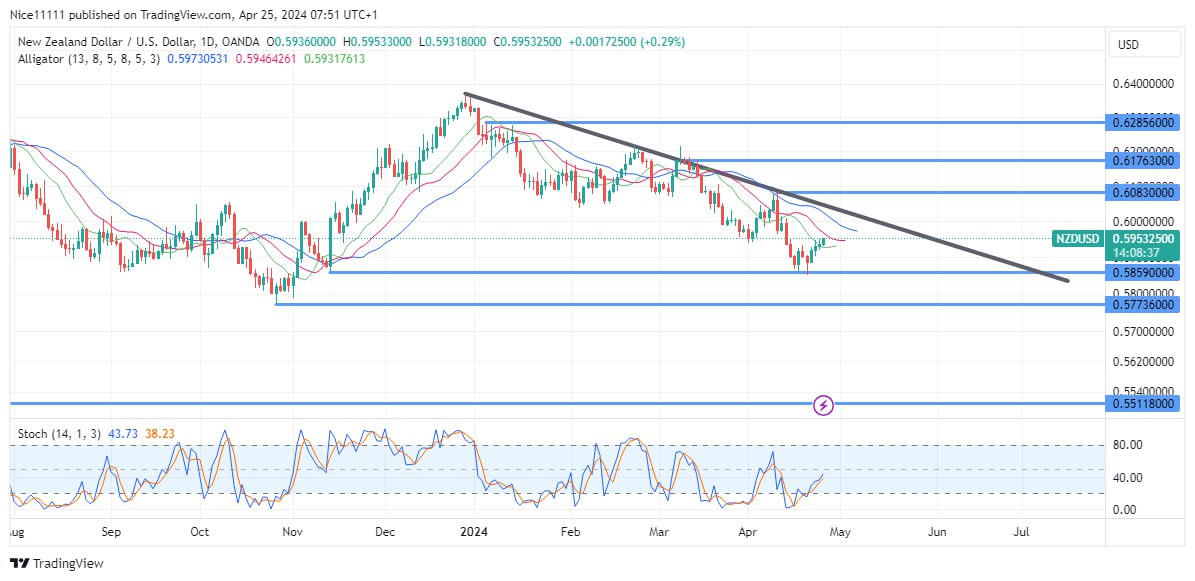
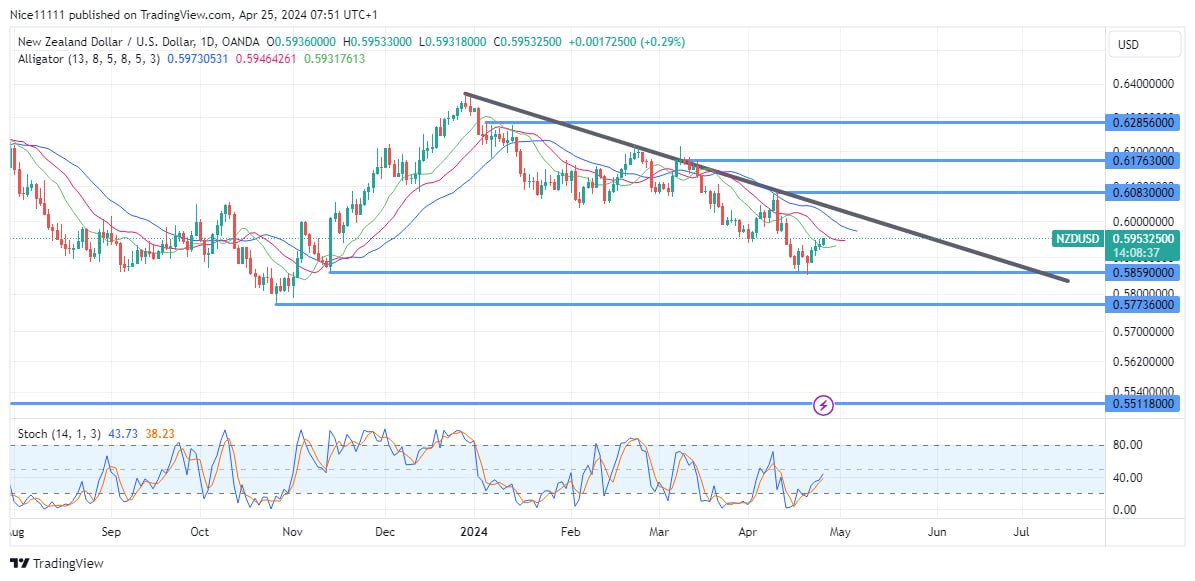
NZDUSD witnessed a notable shift towards bearish market sentiment at the onset of the year. The preceding year concluded with the Stochastic indicator reaching the overbought region, marking the beginning of a significant price decline. The confirmation of this bearish sentiment was solidified as the William Alligator indicator rose above the daily candles, affirming the dominance of the bears in the market.
Key Levels for NZDUSD:
Demand Levels: 0.58590, 0.5770, 0.5510
Supply Levels: 0.6080, 0.6180, 0.6290

Following the establishment of this bearish trend, a correction phase ensued during February and March. Swing highs were utilized to delineate a bearish trendline, with a double top formation at the resistance level of 0.6180 contributing to the restoration of the downward momentum.
The recent test of the bearish trendline propelled the price towards the demand level of 0.5860. However, indications of a reversal remain elusive, with the current retracement attributed to the testing of demand levels.

Market Expectations:
While the daily chart suggests a bearish retracement, the 4-hour chart hints at a potential trend reversal. Considering the higher timeframe perspective, the resumption of the downward price trajectory is anticipated in the near term. Analysis of the 4-hour chart reveals bullish activity, as indicated by the William Alligator, while the Stochastic oscillator signals an impending downturn, already positioning the market in oversold territory. It is anticipated that the market will breach the last swing low of 0.5860 in the foreseeable future.
Note: Forexschoolonline.com is not a financial advisor. Research before investing your funds in any financial asset or presented product or event. We are not responsible for your investing results


Leave a Reply