Market Analysis: Bullish Momentum Switches to Bearish
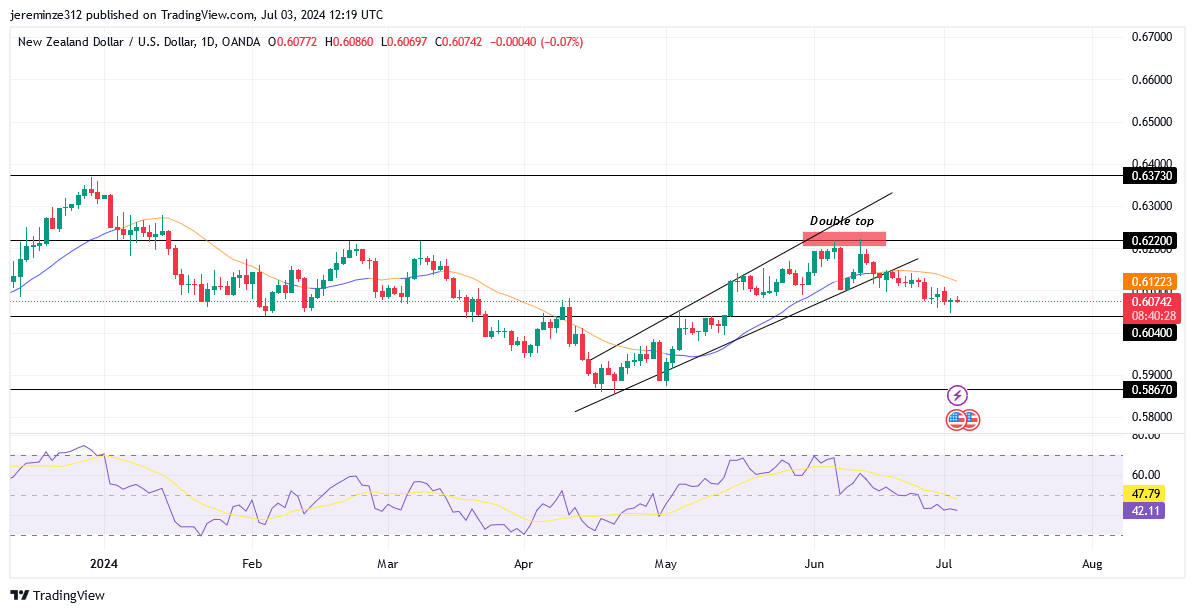
NZDUSD currency pair has been on a landscape of shifting trends, with bearish momentum finding substantial footing at the 0.58670 support level, subsequently propelling the currency pair into a bullish trend. The upward trend that ensued began to show signs of exhaustion as it approached the 0.62200 mark in early June 2024. This level acted as a critical juncture, solidifying itself as a formidable resistance point that stifled the bullish momentum, ultimately triggering a trend reversal.
NZDUSD Significant Zones
Resistance Levels: 0.62200, 0.63730
Support Levels: 0.60400, 0.58670
The emergence of a double top reversal pattern at the 0.62200 threshold was a notable chart development, signaling a potential decline as it coincided with the breach of the prevailing bullish trend line. Further technical confluence was observed on the 4-hour timeframe, where a shift in market structure added weight to the bearish narrative.
Compounding the bearish outlook, the daily Relative Strength Index (RSI) demonstrated a descent toward the 30.0 threshold, an area traditionally associated with oversold conditions. This indicator of waning price strength lends credence to the forecast of a downward price movement, piercing below the 0.60400 level. Forex signals have highlighted this as a significant bearish signal, pointing traders to potential short opportunities.

Market Expectation
NZDUSD is expected to break below the 0.60400 level, potentially leading to a further decline and eventual breach of the 0.58670 level.
Note: Forexschoolonline.com is not a financial advisor. Do your research before investing your funds in any financial asset or presented product or event. We are not for your investing results.


Leave a Reply