Market Analysis: NZDUSD Trends Bearishly Towards the 0.64000 Level
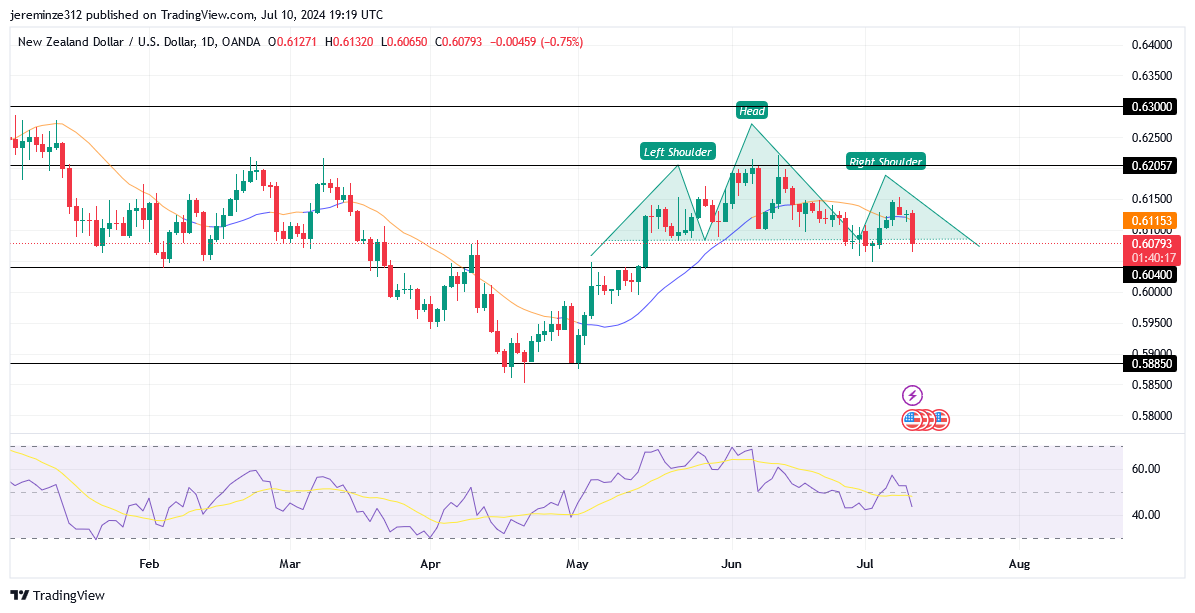
NZDUSD (New Zealand Dollar) has enjoyed a sustained bullish trend against the US Dollar (USD) since the outset of May 2024, but recent price action suggests that this trend may be approaching a pivot. Upon reaching the 0.62050 resistance level, characteristic signals of a potential reversal have emerged.
NZDUSD Significant Zones
Resistance Levels: 0.62050, 0.63000
Support Levels: 0.64000, 0.58850
A critical observation on the daily Relative Strength Index (RSI) revealed that the currency pair entered overbought territory, which historically precedes a trend reversal as observed on trading platforms. This potential shift was further substantiated when the NZDUSD pattern evolved into a reverse head and shoulders formation, a classic indicator of the conclusion of a bullish phase.
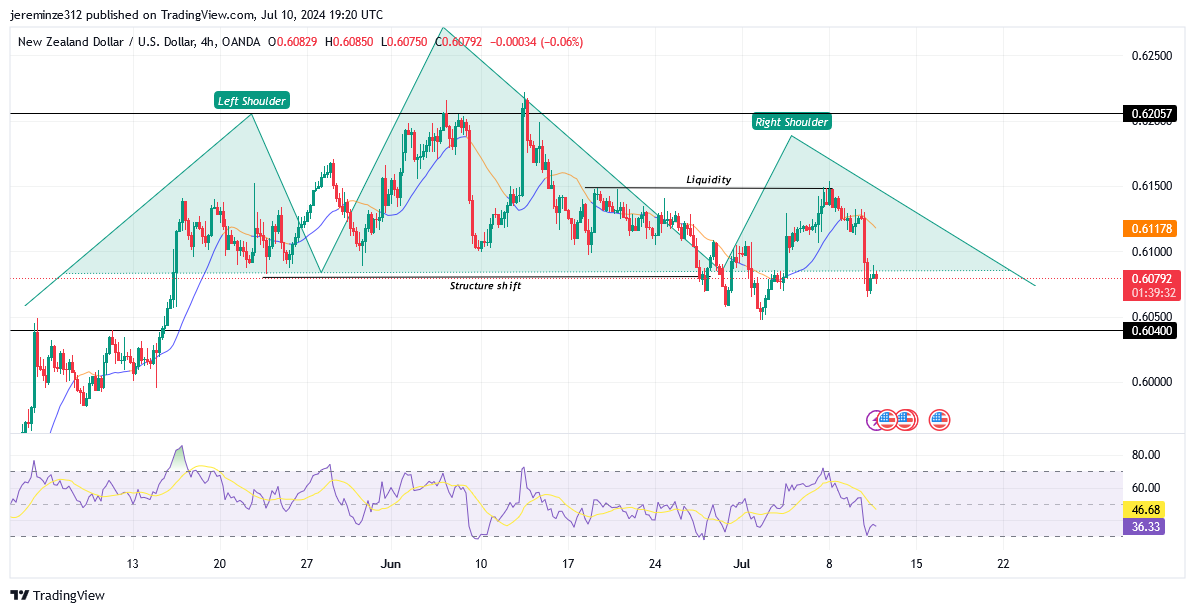
Complementing the daily chart bias, the 4-hour timeframe has demonstrated a market structure shift, lending additional weight to the bearish outlook. The recent “taking of liquidity” on this timeframe is a precursor for a bearish move, and indeed, the NZDUSD has begun to descend on the 4-hour chart.

Market Expectation
Currently, the market is still in the nascent stages of this reversal. The expectation is that the NZDUSD pair may continue its downward trajectory, potentially breaching the 0.60400 demand level as bearish momentum gains traction. Forex signals indicate that traders should monitor these key levels closely for potential trading opportunities.
Note: Forexschoolonline.com is not a financial advisor. Do your research before investing your funds in any financial asset or presented product or event. We are not for your investing results.


Leave a Reply