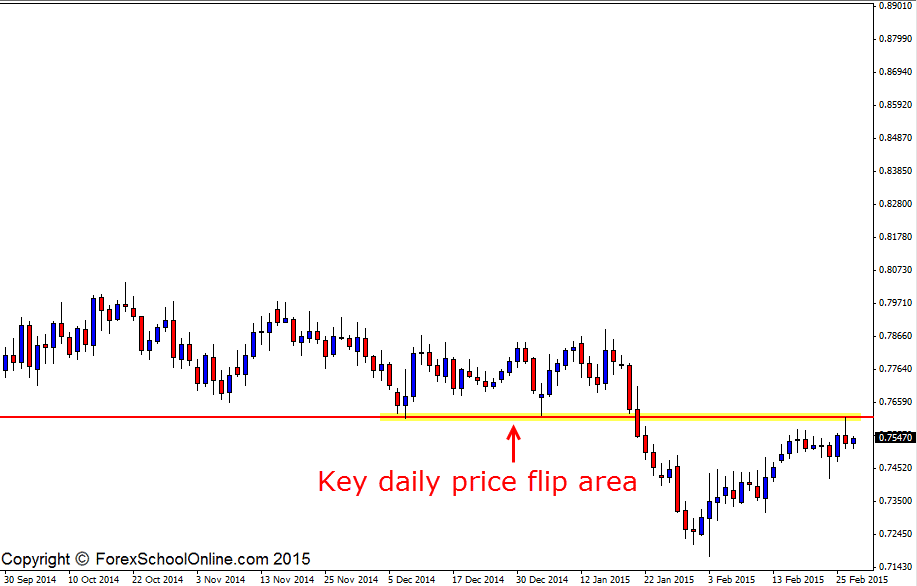
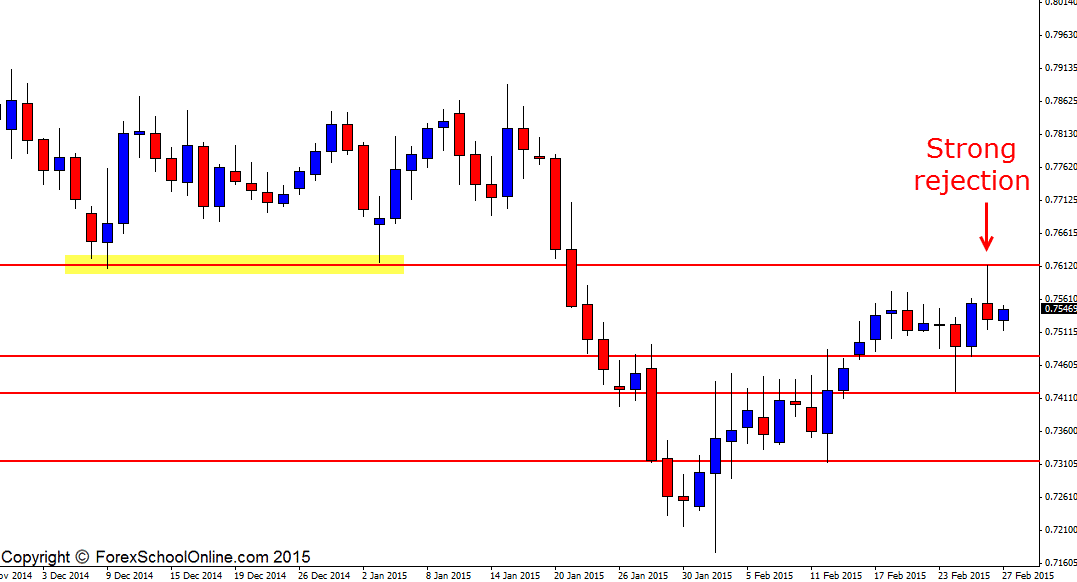
The NZDUSD has rejected a daily price flip resistance area with a strong bearish rejection candle. This bearish rejection candle is showing that price is holding beneath the resistance price flip level at this stage, with price rejecting the resistance and selling off lower.
This new resistance level has been a very solid previous support level in the past with price having twice been held up and not been able to break through lower. Price is now testing this resistance and price flip after a strong move higher. Whilst the trend has been lower in recent months, price has made a very strong push higher in the last two weeks and has made a lot of strong short term momentum. The key daily resistance level is going to be crucial to where price goes in the coming days and weeks.
If price breaks lower beneath the bearish rejection candle and can gain momentum, then it could be a potential signal for the trend lower to continue. Traders would still need to be on their toes and on the lookout for price action clues because as the daily charts show below; there are a few important trouble areas that could act as minor support levels.
If price breaks higher and through the resistance level and also through the bearish rejection candle high, then the resistance level could once again become a new price flip and new support area. As I discuss in the trading lesson; The Secrets Traders Can Learn From Candlesticks & Price Action it would be super important if price does break higher that price does not just pop higher, but that price closes out and above the daily resistance level and then traders could start looking for the price action to starting testing the level as a new support.
NZDUSD Daily Chart

NZDUSD Daily Chart


Leave a Reply