NZDUSD Analysis – Price Reaches a Year Low as It Breaks 0.68000
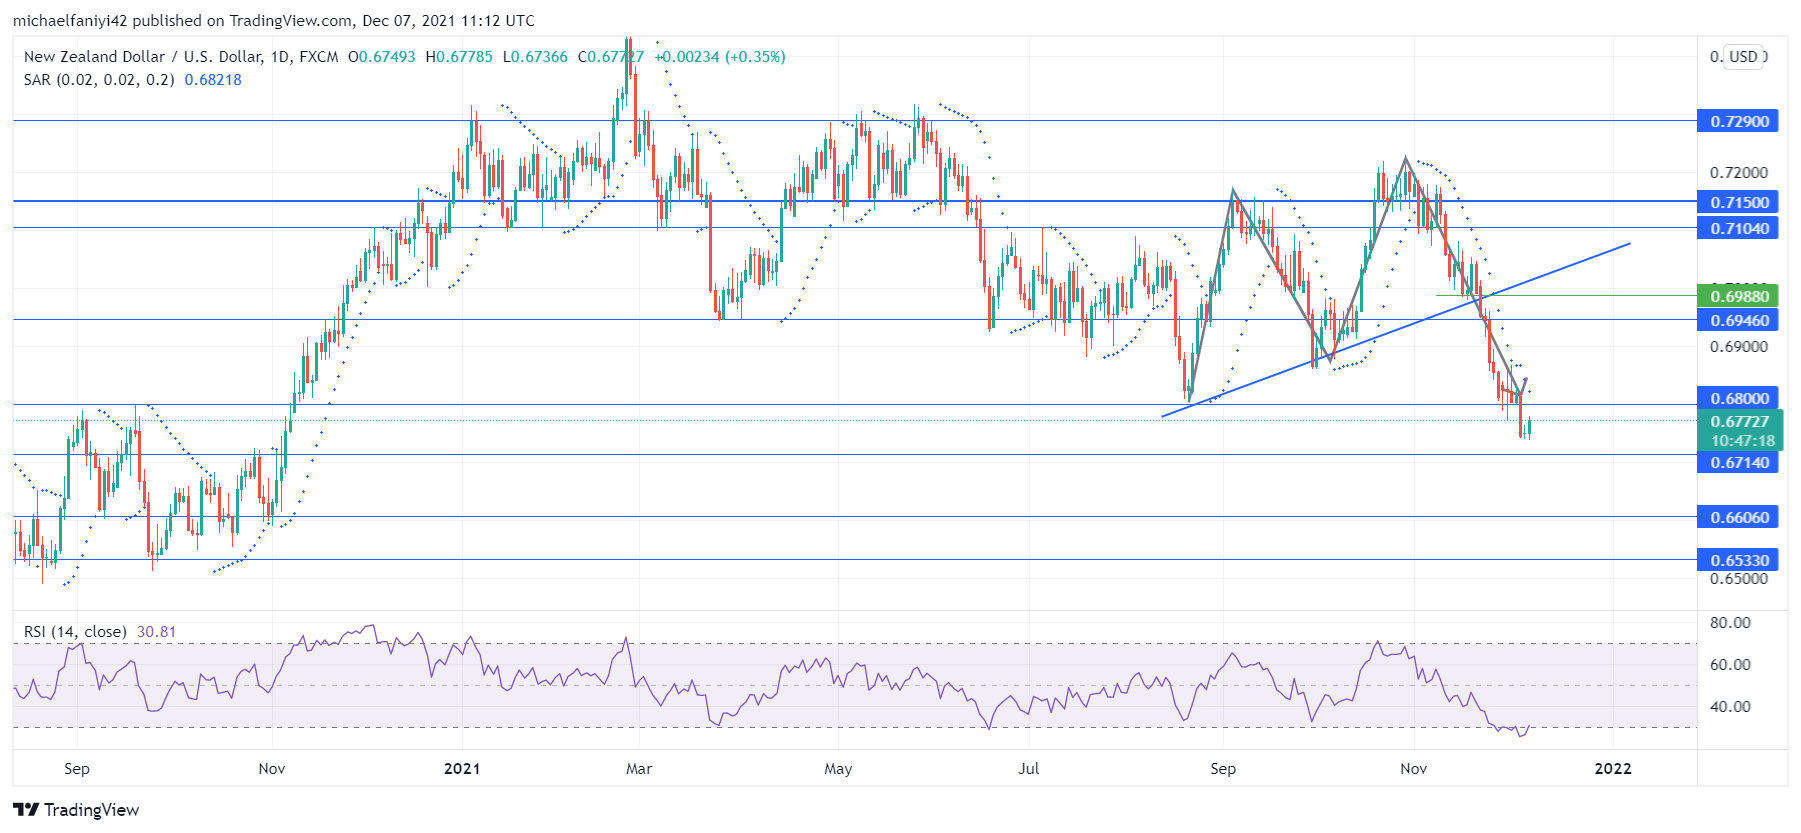
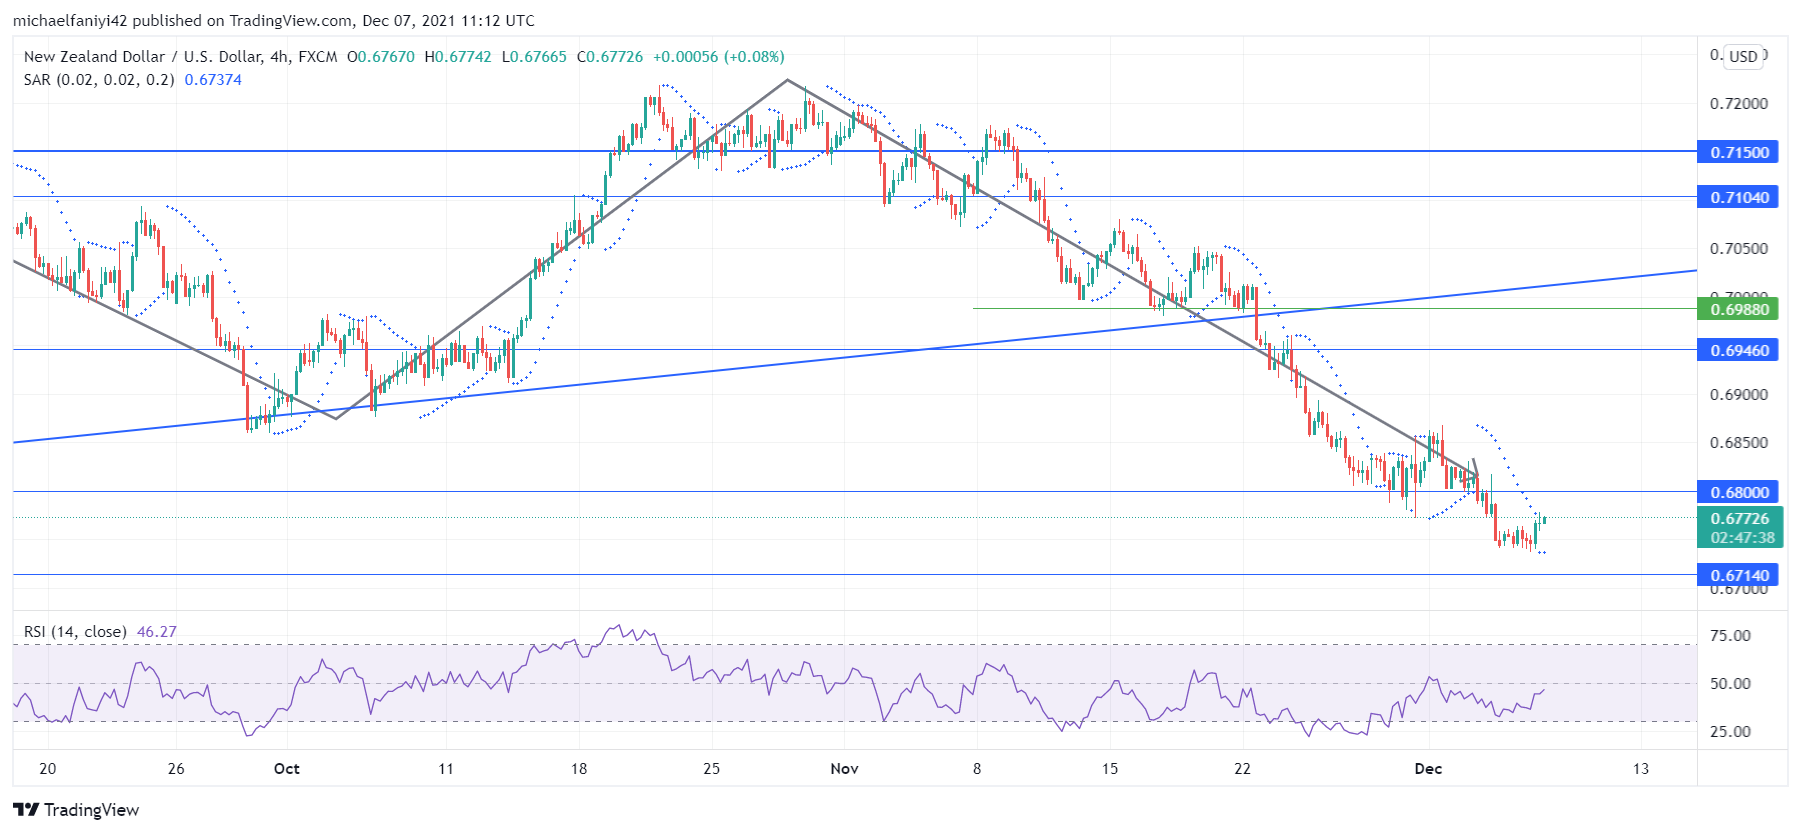
NZDUSD reaches a year low after it falls below the 0.68000 critical level. Having broken the neckline of a slanting double top formation, the price dropped beyond the 0.69880 support level and also broke through 0.69460. The price then slumped directly to 0.6800. The bulls were assumed to keep NZDUSD on hold at this point to reverse the market, but sellers forced their way through and the price reaches a year low.
NZDUSD Significant Levels
Resistance Levels: 0.72900, 0.71500, 0.71040
Support Levels: 0.69880, 0.68000, 0.67140 The market immediately went into a ranging phase after dropping from a price holding level of 0.71500 on the 14th of June. This lasted for 2 months before bears started tugging harder at the market. This collapsed the market to the initial year low. However, buyers became market active and caused a sharp turnaround in the market, which also pumped the price back to its initial holding level of 0.71500.
A tussle ensued between buyers and sellers, which created a double top formation and plunged the NZDUSD back to 0.68000. Buyers were expected to hold off the sellers at this level just like the previous time, but bears forced their way through to sink the market to a new year low. With the price hovering above 0.67140, the price is now retracing back to 0.68000. This retracement is set to be followed by even more market falls. All indicators point to a severely bearish market.
 Market Anticipation
The Parabolic SAR (Stop and Reverse) indicates a market pullback with two dots below the 4-hour chart. The RSI (Relative Strength Index) indicator also echoed the same sentiment as its signal line rose towards the middle mark. This market retracement is expected to be followed by a further market fall to 0.67140 and beyond.
Note: Forexschoolonline.com is not a financial advisor. Do your research before investing your funds in any financial asset or presented product or event. We are not responsible for your investing results.


Leave a Reply