NZDUSD key Zones
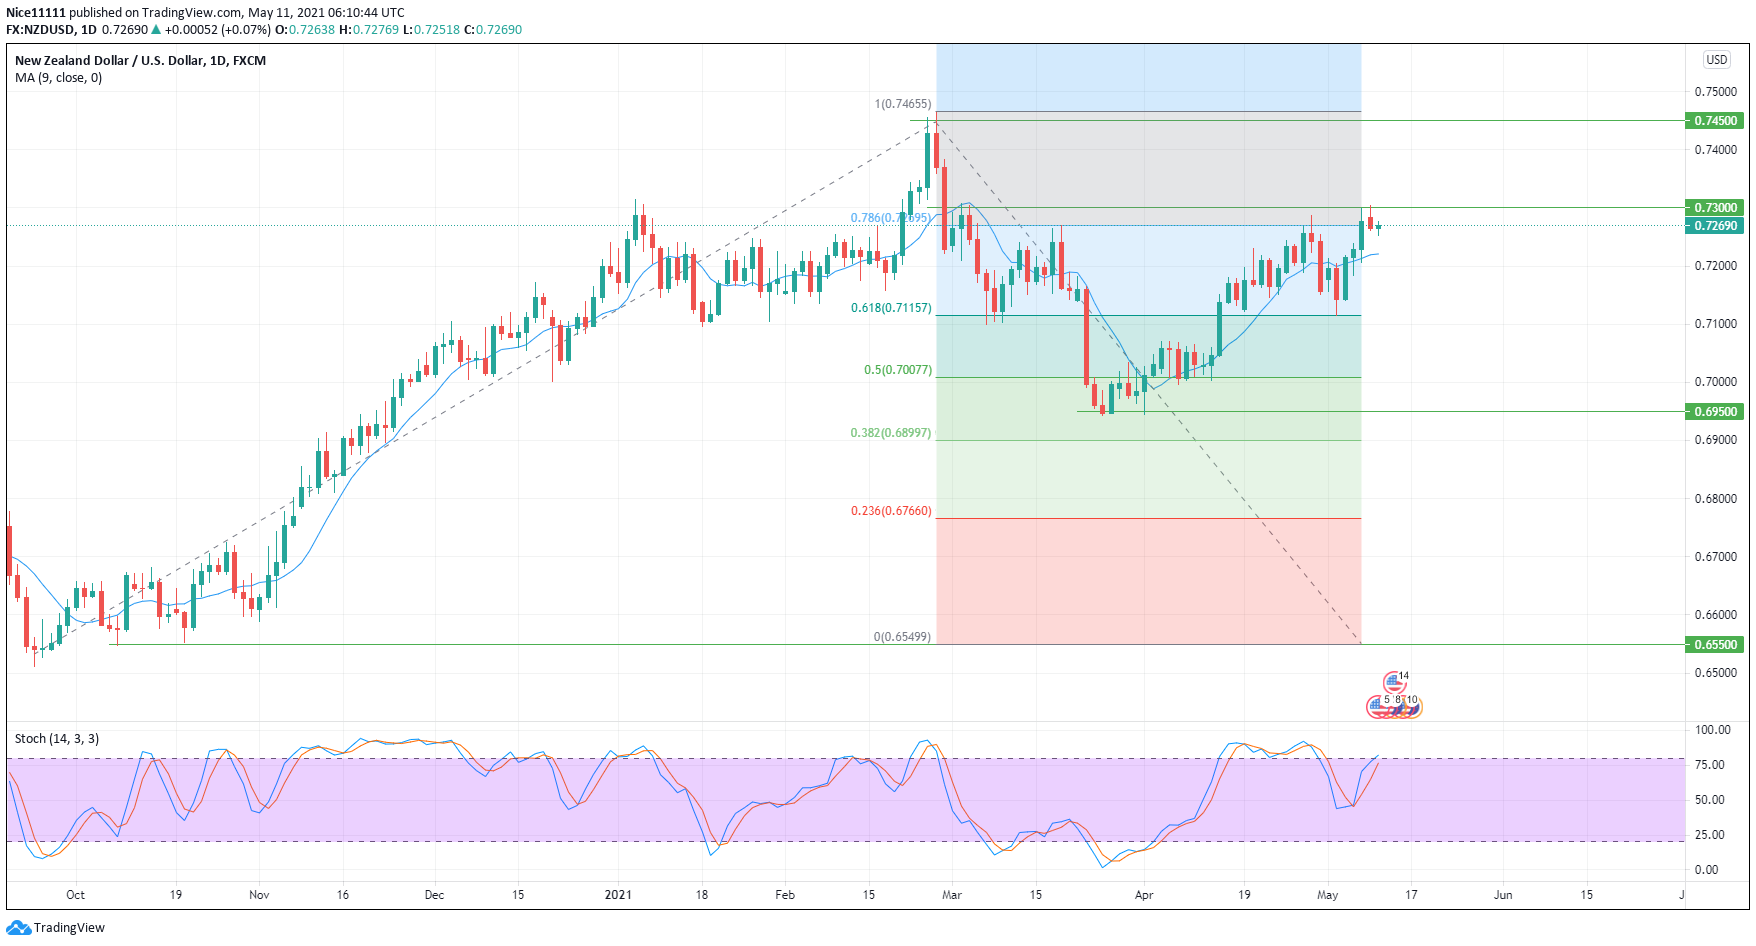
Demand areas: 0.7450, 0.7300
Supply areas: 0.6950, 0.6550
NZDUSD Price Analysis
NZDUSD retraced past equilibrium below 0.5 on the daily chart before continuing the ride upwards. It retraced to 0.6950 on the 25th of March where it resumed its upward trend. The uptrend was defended by a resistance zone at 0.7300. Price was bounced off at the resistance level with two bearish candles upon hitting the resistance level. Price eventually dropped to 0.618 on the Fibonacci to find support. NZDUSD price rose but has been halted the second time at the resistance level. The resistance level at 0.7300 has successfully defended price from going higher as bearish candles are seen forming upon reaching the zone.

NZDUSD Expectations
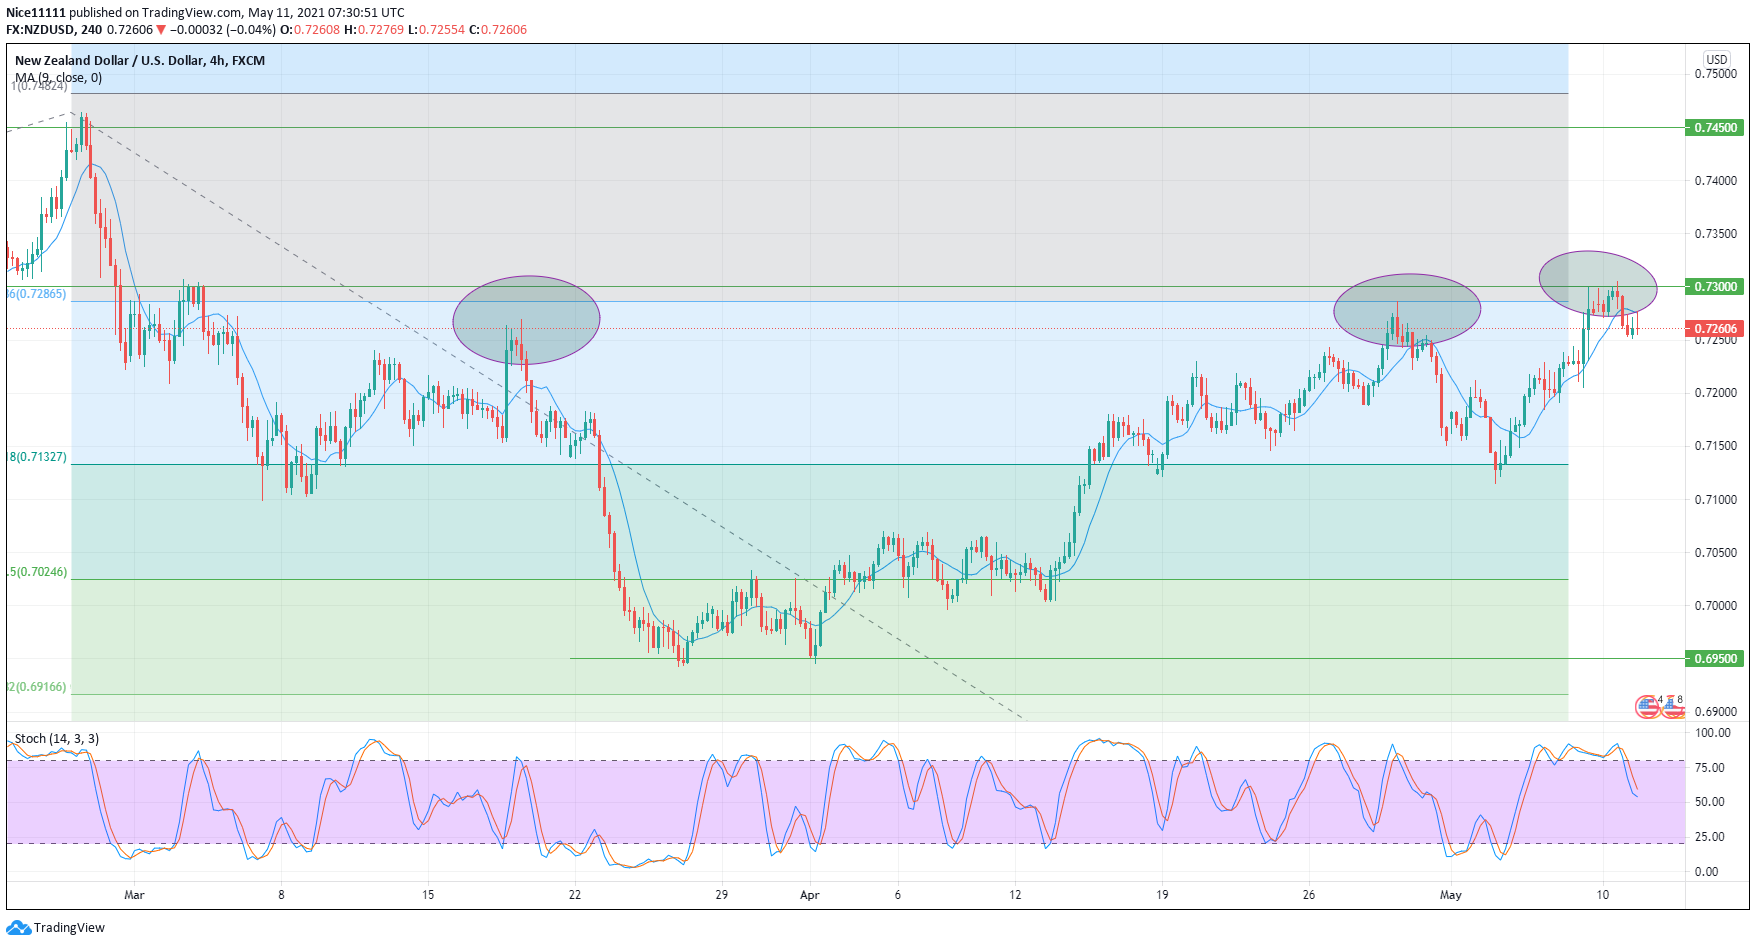
Price has been rejected upon reaching the resistance level at 0.7300. Price is likely to drop to seek support at 0.618 Fibonacci level. Price might even drop further into 0.6950 support level. This might cause price to keep ranging between the support and resistance level, till there is sufficient energy to break through these zones.
The Stochastic indicator has its lines just entering the overbought region. The blue line is currently on 80.11. This is a call for selling in the market as price is likely to drop.

On the four-hour chart, the moving average has already dominated the last three candles showing price willingness to drop into the next support at 0.6950.
The Stochastic shows a bearish drive from the overbought region as it aims for the oversold region. The current resistance level has propelled price lower.
Note: Forexschoolonline.com is not a financial advisor. Do your research before investing your funds in any financial asset or presented product or event. We are not responsible for your investing results.


Leave a Reply