NZDUSD Analysis: Price Market Faces Sharp Rejection at 0.67130 Resistance Level
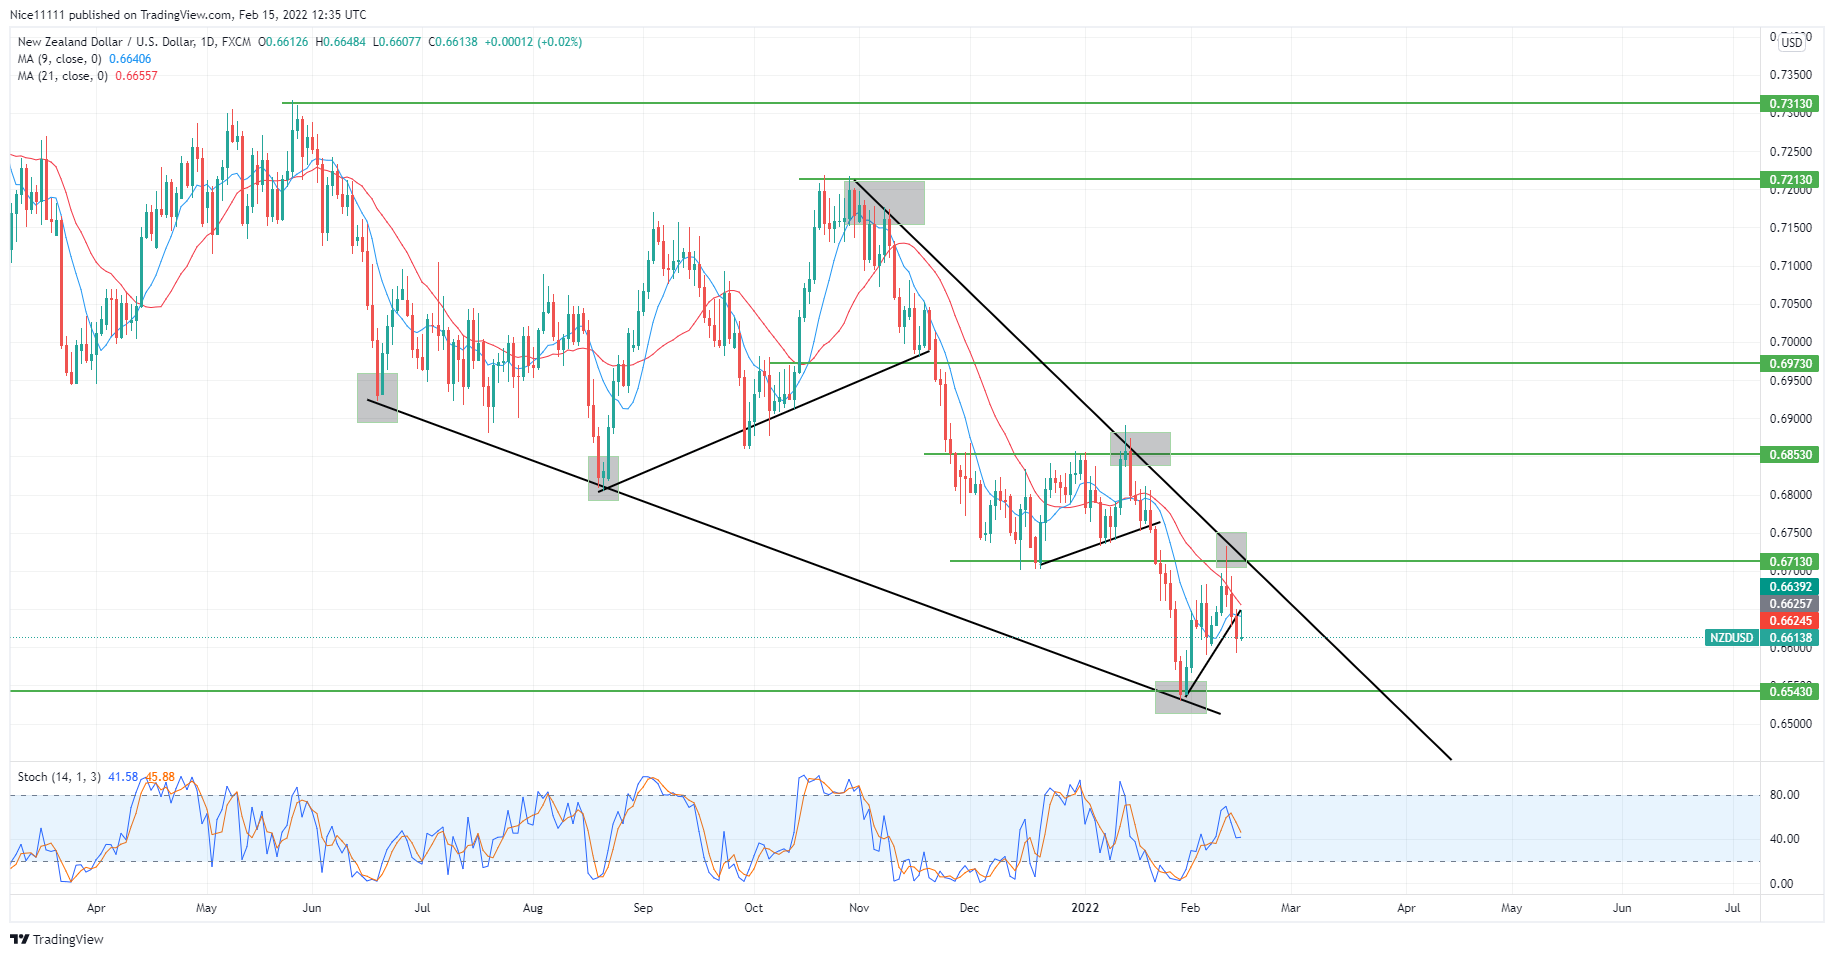
NZDUSD faces sharp rejection at the 0.67130 resistance level. The market has been down-trending on the daily time frame. The trend has formed a descending channel. The lower border has been tested three times. The market tested the lower boundary on the 21st of June and the 23rd of August last year and on the 28th of January this year.
NZDUSD Major Levels
Resistance Levels: 0,73130, 0.72130, 0.68530
Support Levels: 0.65430, 0.67130, 0.69730 The bounce on the lower border on the 24th of August pumped the price into the 0.72130 resistance zone. A few days after the price smashed the resistance zone, the Moving Average period 9 and the Moving Average period 21 crossed to confirm the market reversal. The market dropped to the 0.67130 support level. The market consolidated between the 0.68530 resistance level and the 0.67130 support level.
The Stochastic indicated that the market was oversold earlier this year on the 13th of January. This caused a false breakout above the 0.68530 level. A wick formed above the resistance level, showing a sharp rejection. The downward trendline also acted as resistance, lowering the price to the 0.65430 level.
 What to Expect From NZDUSD
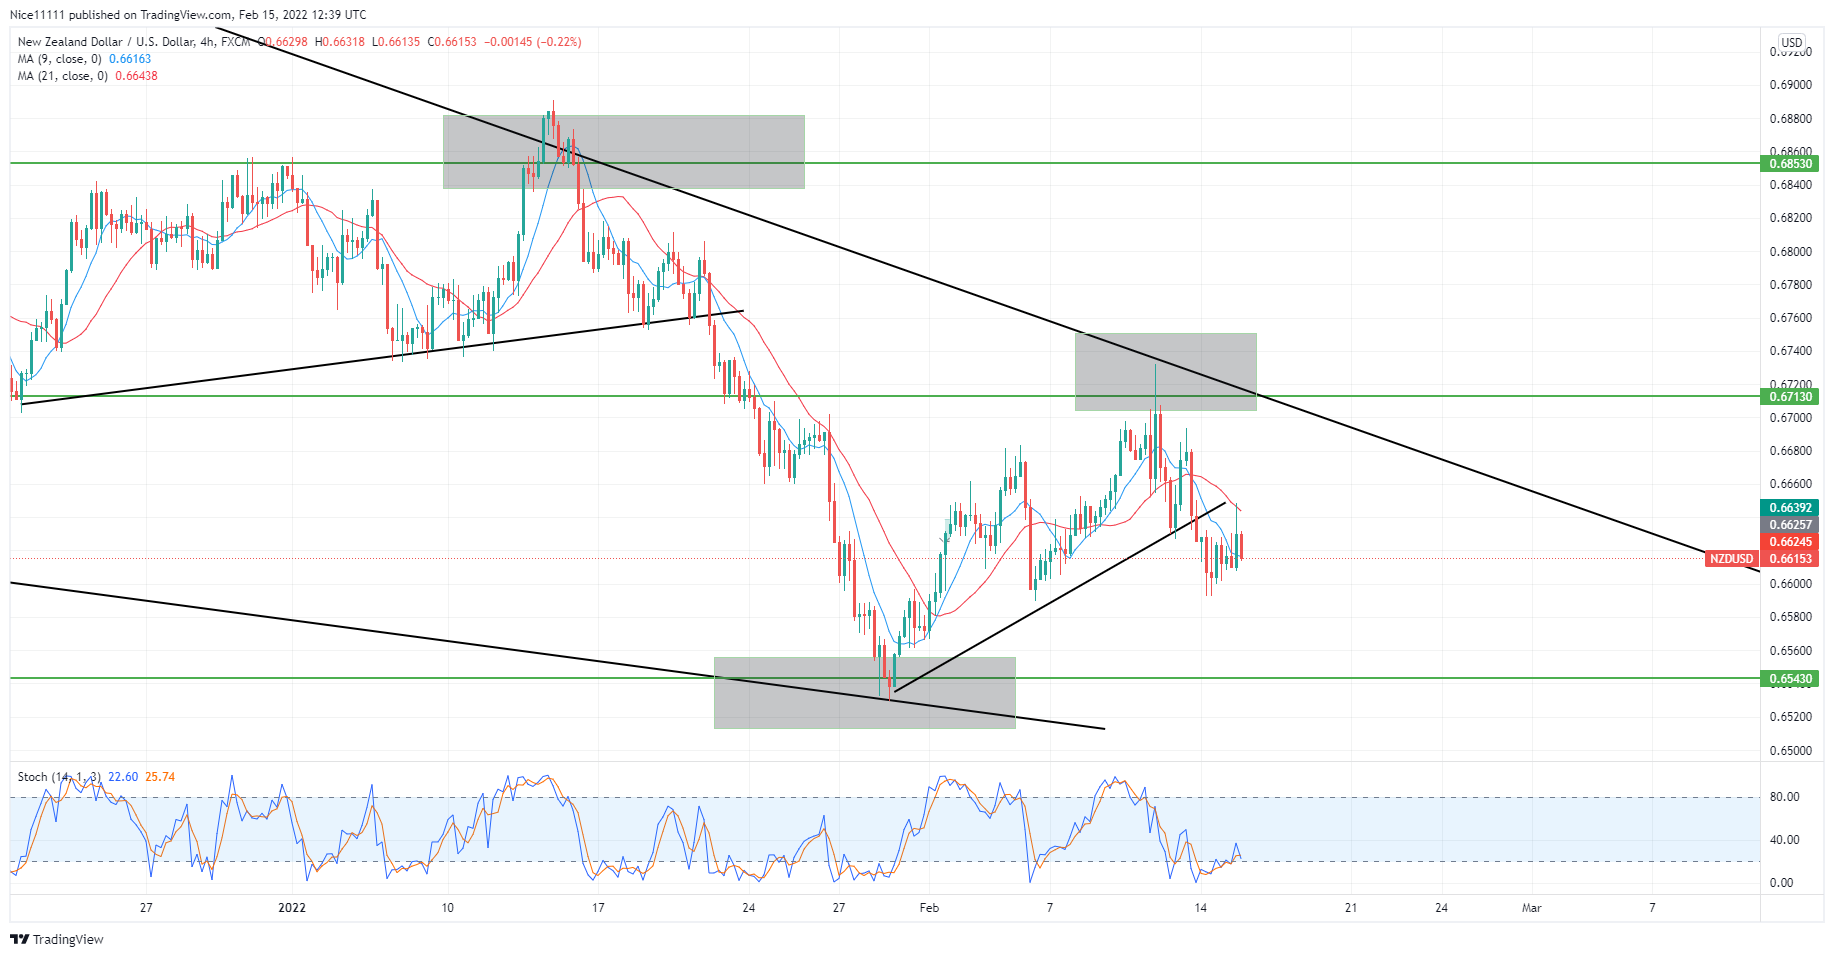
The market dropped to 0.65430 after the rejection at the 0.67130 resistance level. The support zone caused an upthrust in the market as the buyers went long. A sharp rejection at the resistance level was noticed with a long wick. The price has continued to fall since the rejection at the resistance level. On the four-hour chart, the Moving Average period 9 and the moving average period 21 have crossed, facing the downside and aiming for the 0.65430 support level.
Note: Forexschoolonline.com is not a financial advisor. Do your research before investing your funds in any financial asset or presented product or event. We are not responsible for your investing results.


Leave a Reply