Market Analysis: NZDUSD Failure to Create Higher High Suggests Price Reversal
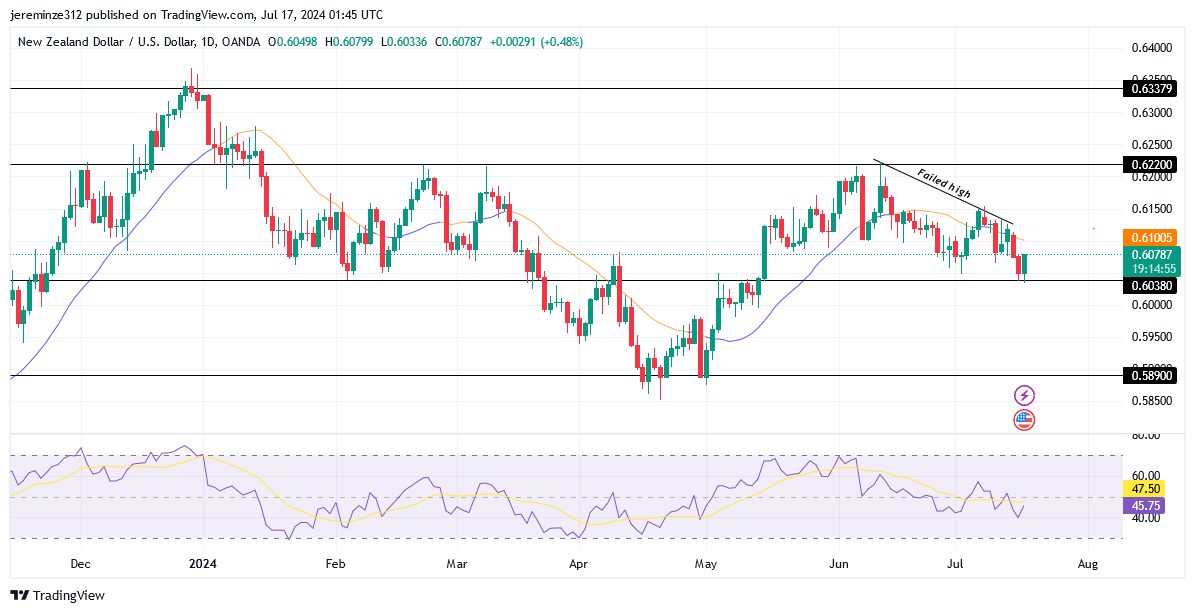
NZDUSD (New Zealand Dollar against the US Dollar) has recently shown signs of a bearish reversal following its inability to break through the key resistance level at 0.62200. The currency pair experienced a strong bullish surge from the support at 0.58900, but the momentum waned upon reaching the 0.62200 threshold, resulting in a significant retracement.
NZDUSD Significant Zones
Resistance Levels: 0.62200, 0.63380
Support Levels: 0.60380, 0.58900
The initial bullish trend’s halt and subsequent failure to overcome the resistance on the second attempt have formed what technical analysts refer to as a “failed high.” This pattern typically indicates a possible trend reversal on NZDUSD. Further bearish indications are corroborated by the Moving Average daily, which now points to a bearish signal with the price currently below the indicator. The Relative Strength Index (RSI) also shows a downward trajectory towards the oversold territory, signaling a reduction in price strength.
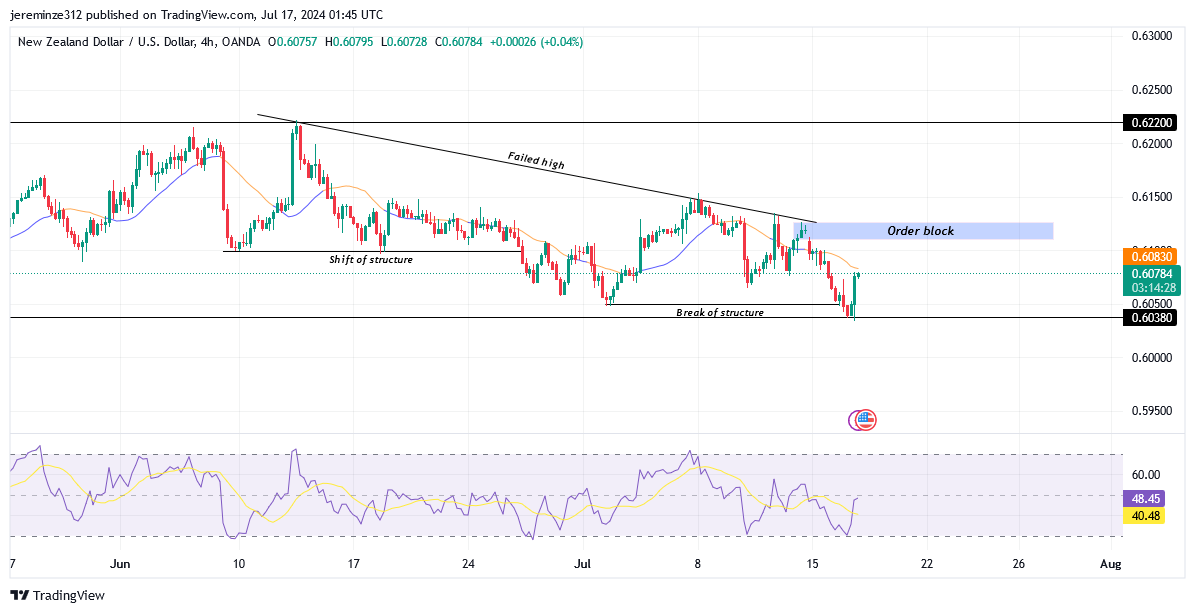
A closer examination of the 4-hour chart reveals a fractal pattern, providing a detailed view of the price structure and recent bearish shift. The break in price structure on this timeframe supports the notion that the bearish trend may continue. Before any further downward movement, it is anticipated that the price will retrace to the order block identified on the 4-hour chart.

Market Expectation
After the 4-hour order block is triggered, the NZD/USD pair may find itself breaching the support level at 0.60380. It is expected that a confirmed break below could pave the way for further declines. According to the latest forex signals, traders should be on the lookout for this potential drop, as it could present significant trading opportunities.
Note: Forexschoolonline.com is not a financial advisor. Do your research before investing your funds in any financial asset or presented product or event. We are not for your investing results.


Leave a Reply