NZDUSD Analysis – Price Breaks Out From Its Downward Channel
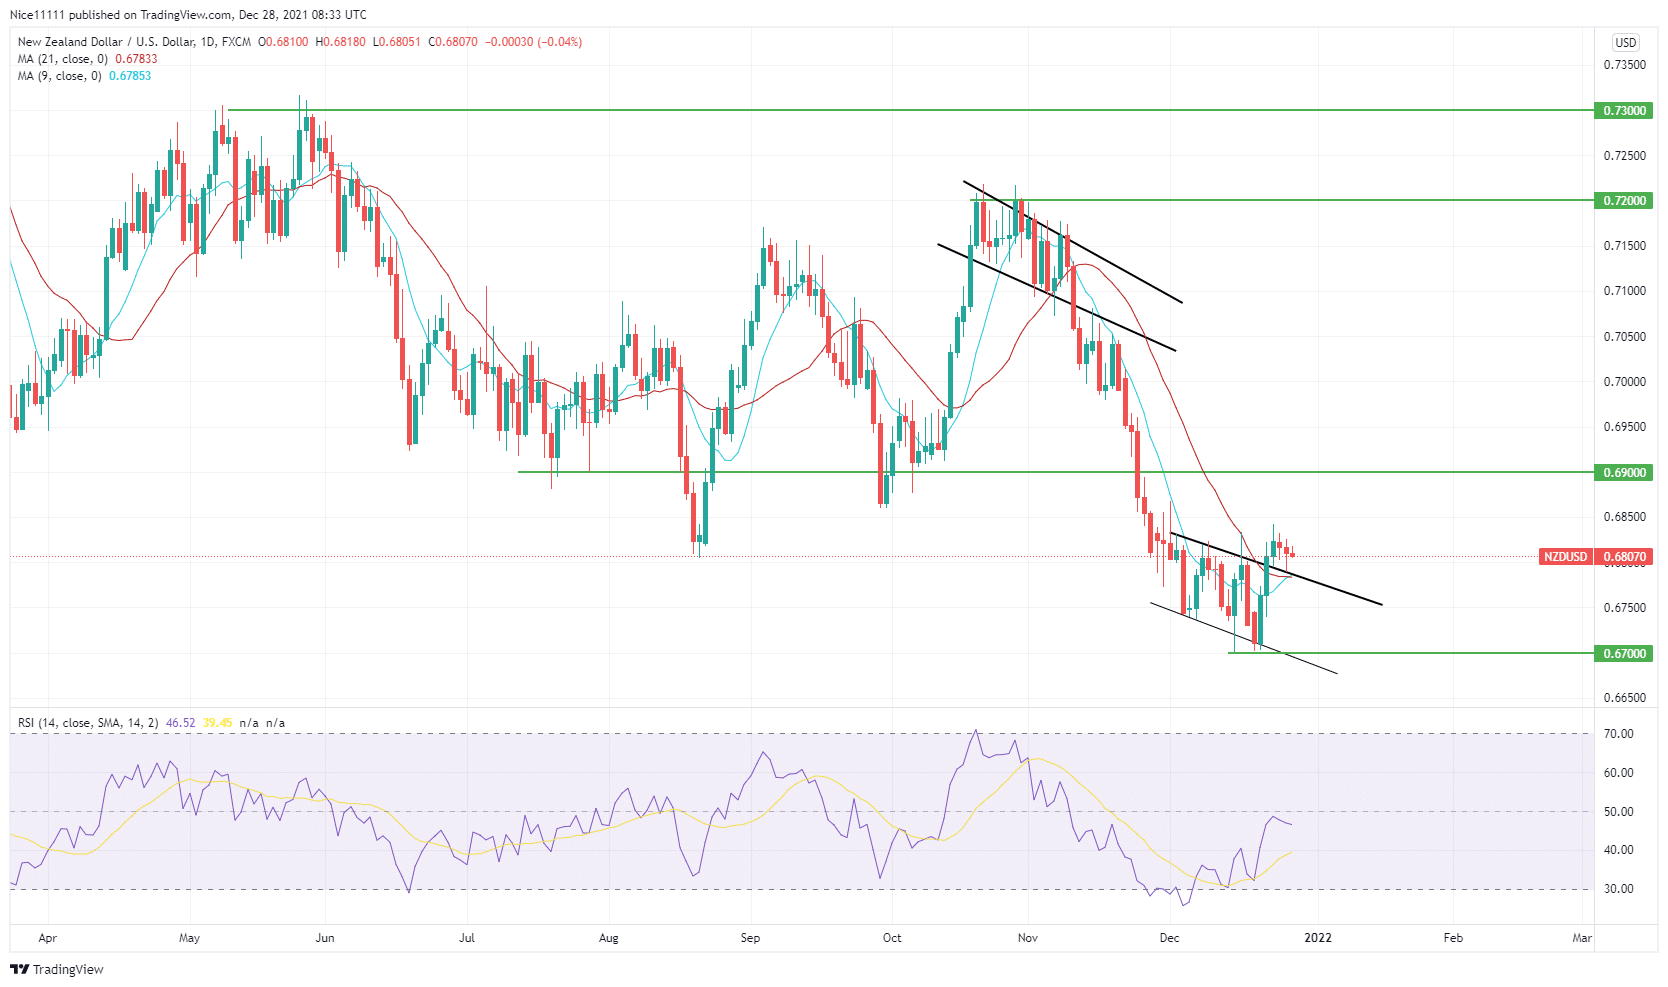
NZDUSD breaks out on the 10th of November after the crossing of the 9 and 21 Moving Averages. The massive breakout led to a dive in the market from the supply zone at 0.720 to the demand zone at 0.690. The 9 and 21 Moving Averages completely rested above the bearish candles, showing the rule of the bears. Just before the final plunge, the downward channel was retested on the 15th of November.
Major Zones on NZDUSD
Market Demand zone: 0.730, 0.720
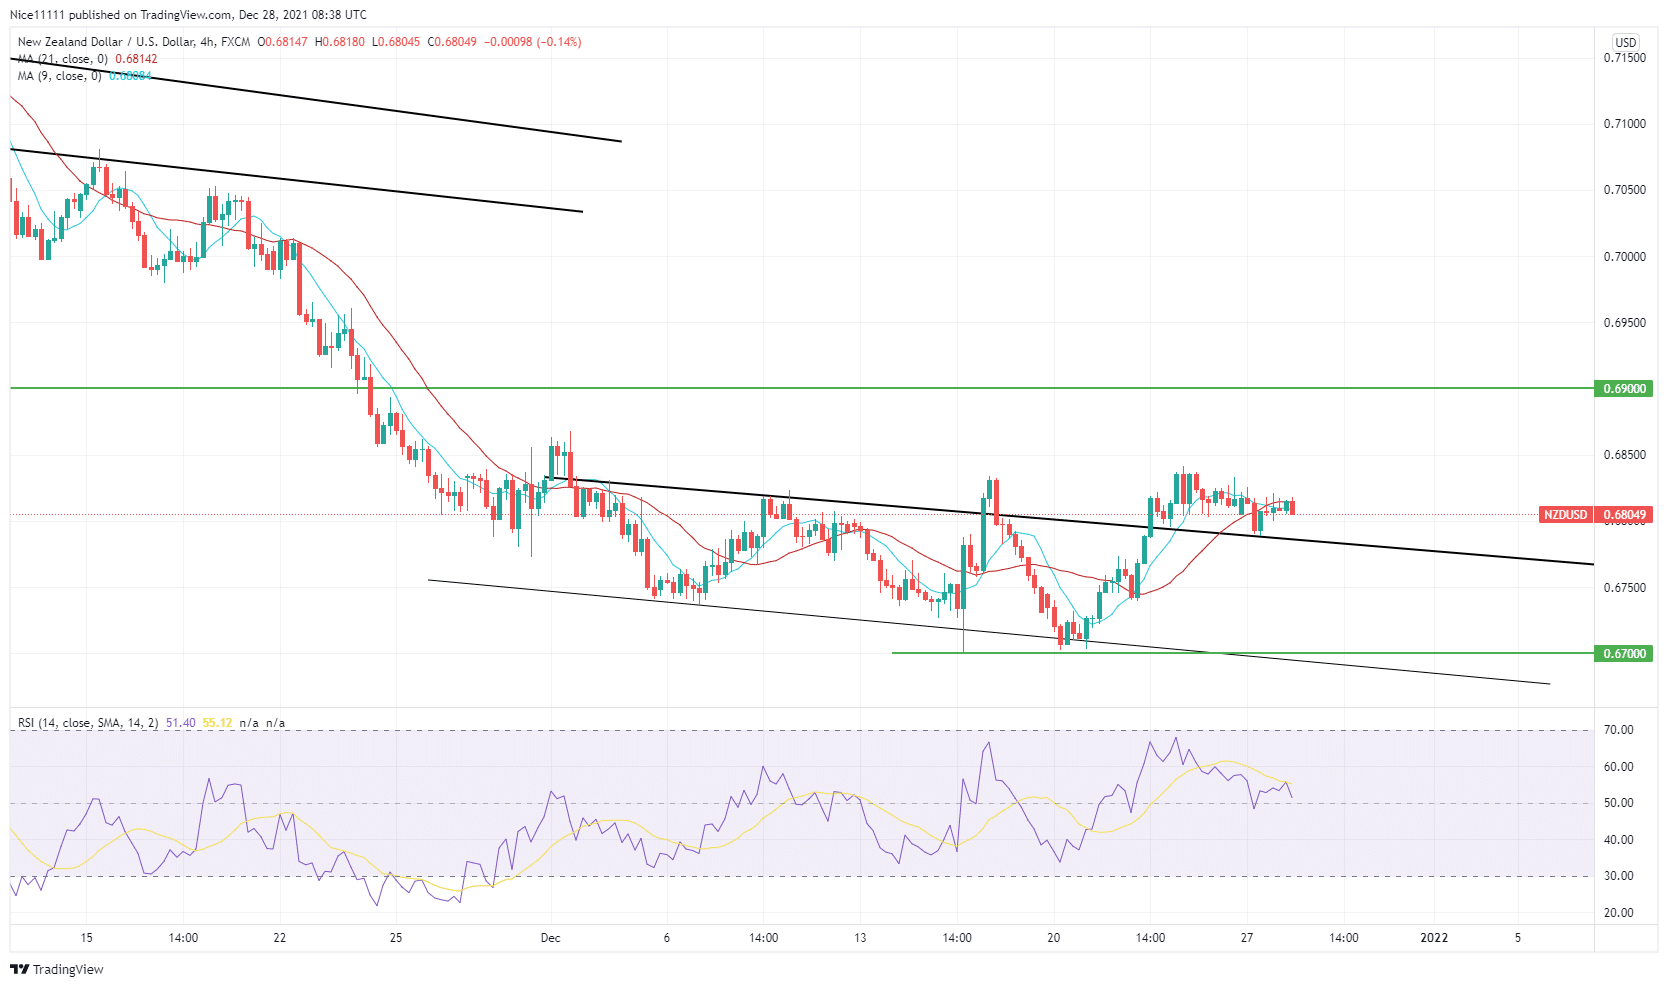
Market Supply zone: 0.690, 0.670 The demand zone at 0.690 failed to hold the price till it sank to 0.670. After reaching 0.670, the demand zone has been tested twice, on the 15th of December and the 2nd of December. The last bounce was also on the downward channel formed just above the demand zone. The bulls used the opportunity to get in and pumped the market above the 9 and 21 moving averages. A breakout and retest are also spotted on the upper border of the channel.
The channel was violated on the 22nd of December. NZDUSD breakout was followed by the retest, which kissed the upper border yesterday on the 27th of December. The moving averages have also experienced eye contact just below the retest formed yesterday.
 Market Anticipation
The retest at the upper border of the downward channel is expected to create support and pump prices higher. Hence, the previously breached demand zone above the current market price at 0.690 is likely to be aimed for. On the four-hour chart, the Relative Strength Index is bullish. It rests just above the midpoint at 50.
The upper border of the downward channel is currently being used as support just as the bulls utilized the zone at 0.670.
Note: Forexschoolonline.com is not a financial advisor. Do your research before investing your funds in any financial asset or presented product or event. We are not responsible for your investing results.


Leave a Reply