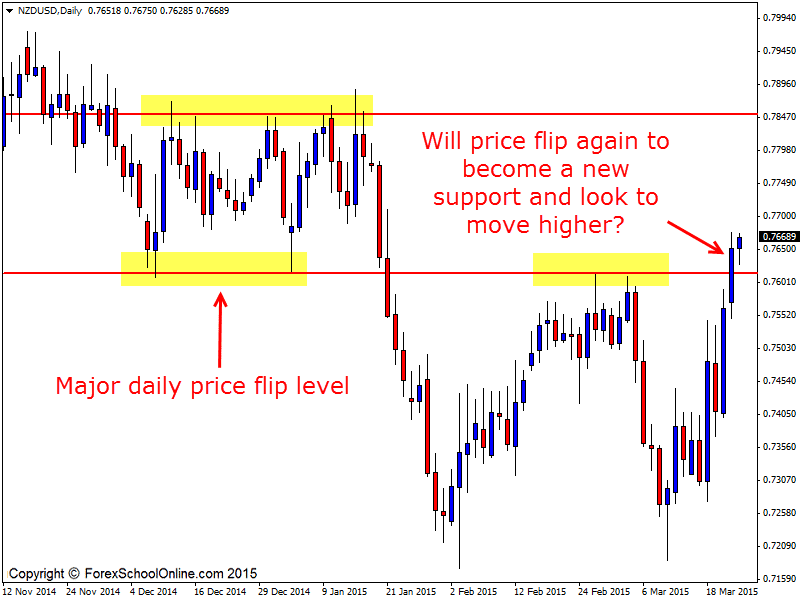
The NZDUSD has just broken and most crucially closed above a major price flip resistance area on the daily price action chart. A lot of times with these really major price flip levels, prices will on the first attempt try and make a breakthrough, but will not be able to close either higher or lower through the major level as price is doing here on the NZDUSD daily chart.
The reason where the price closes is so important is because it is telling you as the price action trader a lot of information about the control of the market. As I discuss in both the video and trading lesson; The Secrets Traders Can Learn From Candlesticks and Price Action where price closes in relation to key levels is crucial and can set up high probability setups.
If the price flip resistance level holds and price is not able to break and close above, then the level clearly has not broken. This is important because you don’t want to be looking for any potential setups such as breakouts or breakout & re-test setups when the level has not broken.
If price was to breakout higher out of the resistance and close out above strongly and stay above the level, then you would be able to start watching this level for potential setups to get long, watching the price action behaviour to make sure that the level is going to hold as a new price flip support area i,e; price has broken higher through the resistance and it has flipped to being a new support level.
With the NZDUSD we can see that this level has been a major level and it has been respected many times. Now that price has broken higher, it could gain momentum quickly and move into the space that is overhead and make a quick move which would not surprise.
This price flip is obviously a major level in this market and there is a good chance that price will want to test it again before making another move. If this does occur, it could provide traders with a really solid chance to look for high probability trading opportunities.
Traders would need to watch the price action behavior closely to see if the new support level is going to hold and if it is, they can then look for bullish trigger signals on their intraday time frames, such as the 8 hour, 4 hour, 2 hour, 1 hour or even smaller time frame charts preferably nothing below the 15 minute time frame chart.
The markets at the moment are alive and many pairs are making really great free-flowing moves and have really confluent levels to hunt trades from. It is really paying to be marking up your charts correctly and being on the ball!
Check out the link I have down below in the related education section for exactly how you need to mark up your Forex charts if you need help with marking up your charts.
If you have any questions on anything, please just post them up in the comments section below.
NZDUSD Daily Chart


Leave a Reply