Market Analysis: Price Anticipates a Bullish Trend with an Ascending Triangle Pattern
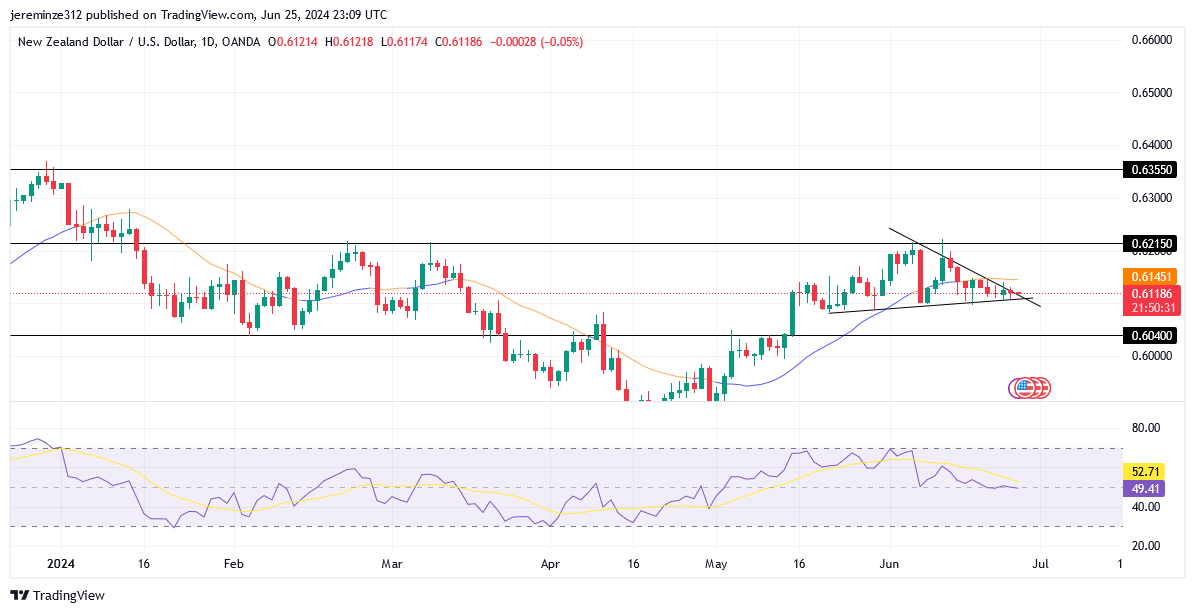
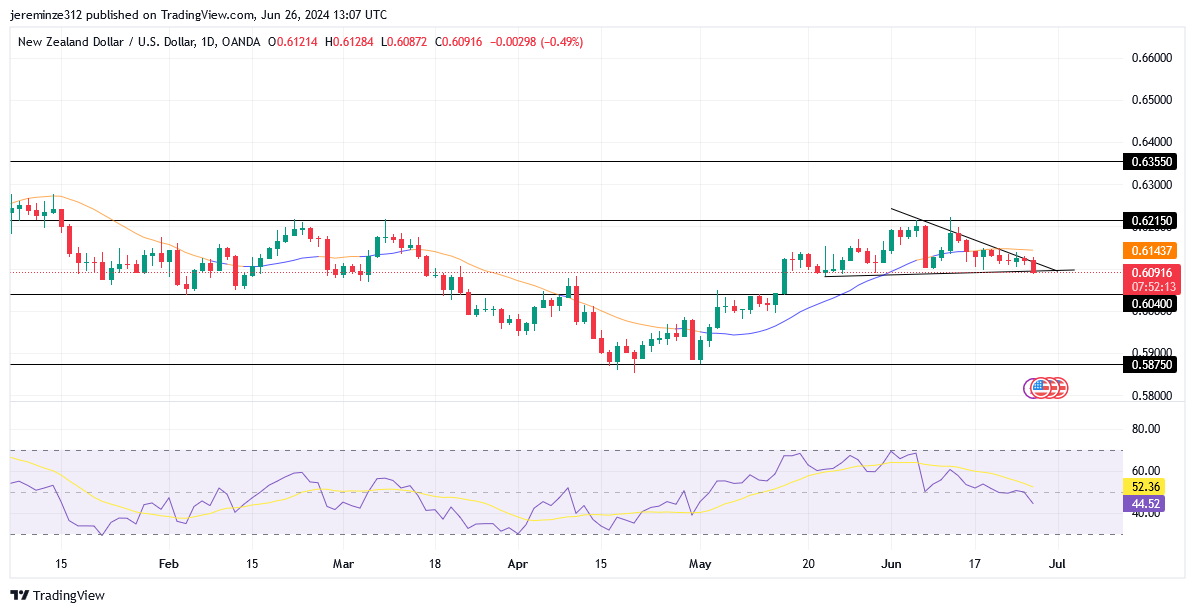
NZDUSD has exhibited a bullish trajectory after rebounding from the 0.58750 support threshold, a level that has historically been significant. This support was rigorously tested, catalyzing a trend reversal that transitioned into a robust bullish phase starting in early May 2024 and extending into early June 2024.
NZDUSD Significant Zones
Resistance Levels: 0.62150, 0.63550
Support Levels: 0.60400, 0.58750
During this period, the price ascent was stymied by formidable resistance at the 0.62150 mark—a supply level that has consistently resisted bullish momentum, as shown by repeated retests that failed to secure a breach. Notably, these recurrent retests appear to have weakened this barrier, suggesting potential for a breakout.
The price has formed an ascending triangle, which is recognized as a bullish signal in technical analysis, further indicating an impending continuation of the upward trend. However, a bullish breakout is projected to precede the anticipated surge. This price action is confirmed by the daily Relative Strength Index (RSI), showing that the price is verging on the oversold domain. This development typically denotes a consolidation phase within the ascending triangle pattern.

Market Expectation
An upturn in the daily RSI is expected to precede the forecasted bullish breakout. Collectively, these indicators suggest a bullish breakout in the near term. Forex signals recommend that traders closely monitor these developments for potential trading opportunities.
Note: Forexschoolonline.com is not a financial advisor. Do your research before investing your funds in any financial asset or presented product or event. We are not for your investing results.


Leave a Reply