NZDUSD 2 Day Pin Bar
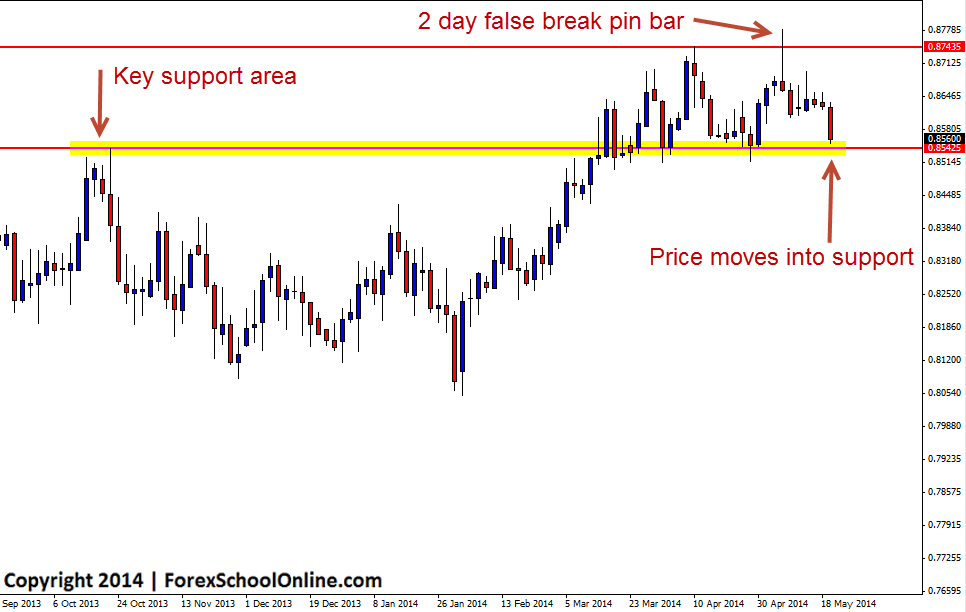
The NZDUSD has now moved lower and into the recent support level after breaking through and confirming the large false break pin bar that had formed on the 2 day price action chart. We posted about this setup as it was unfolding live in this blog and you can read the original post here; NZDUSD Fires Off Large False Break 2 Day Pin Bar. After breaking the pin bars low, price did struggle at the first area we identified in that original post, before now cruising lower and into the recent lows. These large false break price action setups often have a lot of momentum behind them when played from the best areas on the chart and can create solid moves for the switched on price action trader.
NZDUSD 2 Day Chart

US Dollar Index Daily Bullish Engulfing Bar
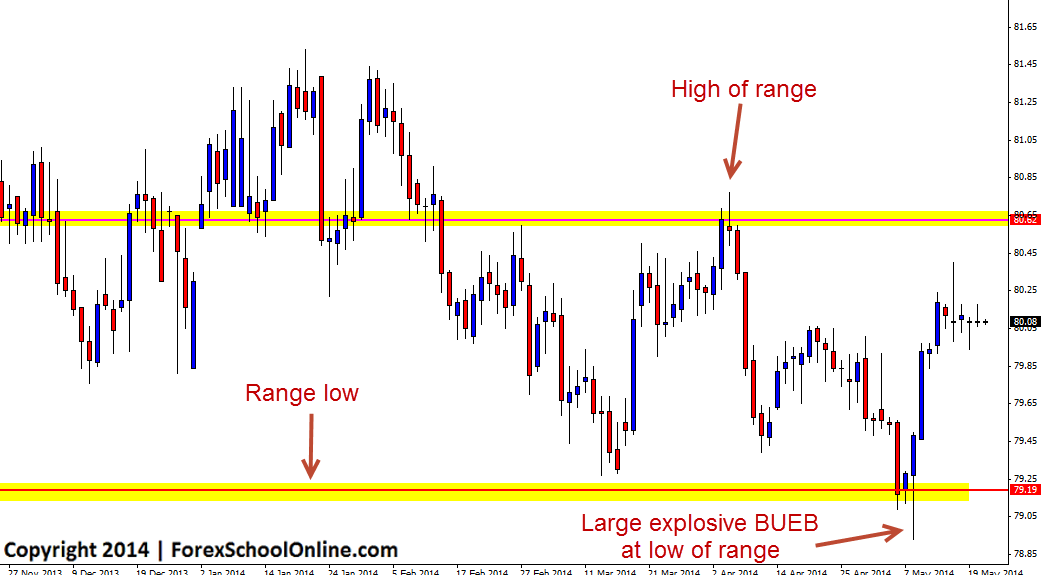
Price has smashed higher on the back of a huge Bullish Engulfing Bar (BUEB) on the US Dollar Index daily chart. This market has been in a sideways trading range market of late, so for traders looking to take trades in this market it is very important they hunt their trades at the correct spots. As I talk about in my latest trading lesson just released: Trading Price Action in Sideways & Ranging Markets | Trading Tutorial some of the best trades can be played in a range, but too many times traders find themselves getting sucked in to making trades in the middle of the range and this is the no mans land. This Bullish Engulfing Bar is a great example of a setup where the price action signal formed at the low of the range, giving the setup a lot higher probability of success which is discussed in detail in the trading lesson.
US Dollar Index Daily Chart

Related Forex Trading Articles & Videos
– How to Make Money One Price Action Setup at a Time – True Story


Leave a Reply