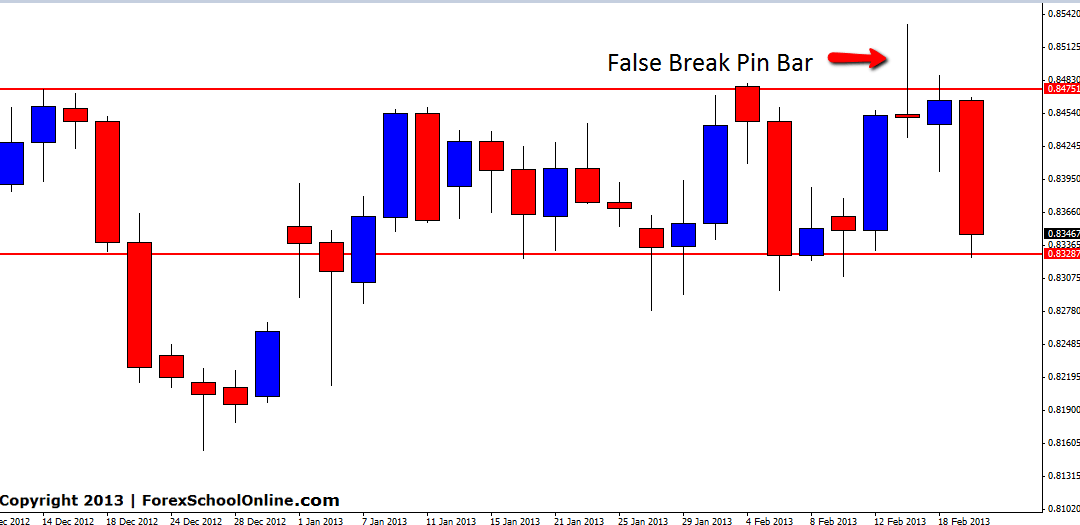
The NZDUSD has moved lower after producing signals on both the daily and two daily charts. The daily chart formed a bearish engulfing bar (BEEB) at resistance and the two day chart showed a bearish false break pin bar.
The cleaner looking setup was on the two day chart where we can see price made a clear bull trap by making a false break out through the resistance area. Both these setups were discussed in the members markets summary and members forum in real time as they formed.
The chart below is a two day chart and shows the Pin Bar signal used to tip traders off to the move lower. This false break of the pin bar nose moving through the resistance before snapping back lower is known as a bull trap which stops a lot of the bulls out who were getting long on the break out through resistance. Traders who took this trade have now had a chance to take profit or at the minimum move to protect their capital by placing their stops to break even as price has moved lower.
Price has now moved into the logical support area where we would have expected price to move into and is now faced with a bit of chop and ranging.
For people wanting to know how to get two day charts with their MT4 they can read this article that explains it: Make Any Time Frame with MT4
We have also just released a new free video which you can watch here: Price Action Commentary and Tutorial
NZDUSD 2 DAY CHART – 21 FEB 2013


Leave a Reply