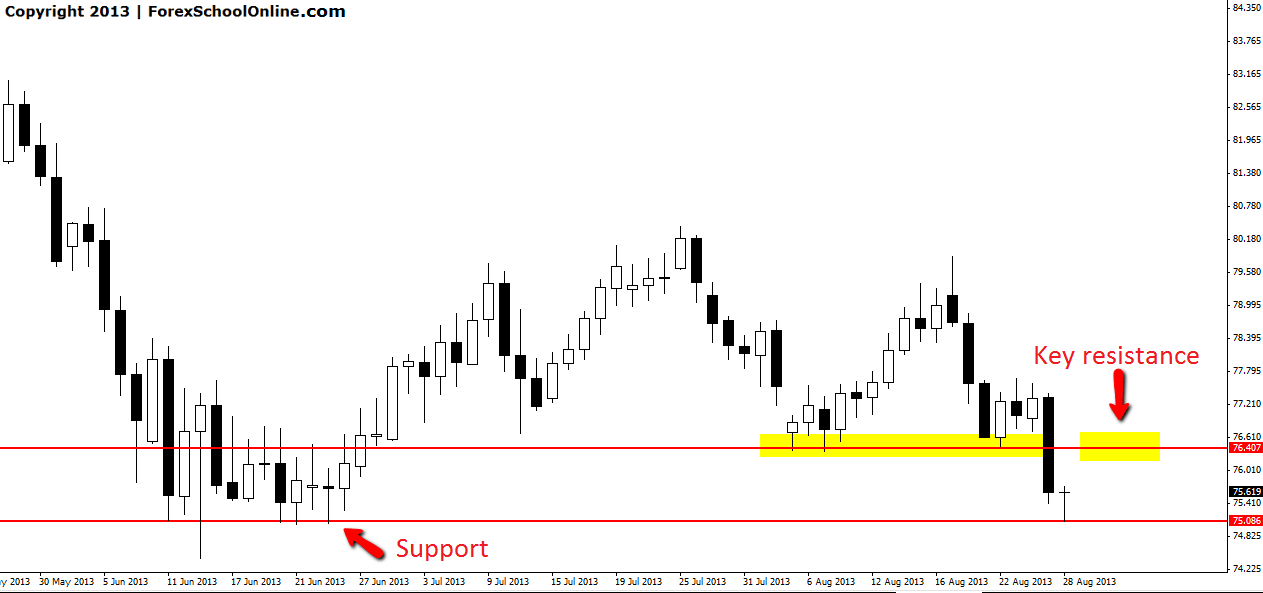
Price on the NZDJPY daily chart has broken lower and through a key support level. This level has been tested and held as support in the past and has been shown to be a key level for this pair. Price has broken through this old support level could now act as a new price flip and new key resistance area if price moves back higher.
Price as I write this blog post is testing the major low support level. If price rejects this level and begins the move higher and up into the key resistance level traders could potentially start looking for bearish price action trades at the key resistance zone. Traders would not just just start taking short trades at this key resistance level. For a trade to be confirmed, a solid price action signal would have to be present at the key area.
NZDJPY DAILY CHART


Hi Johan,
Could have look U/J there may be Pin bar and support to hold…