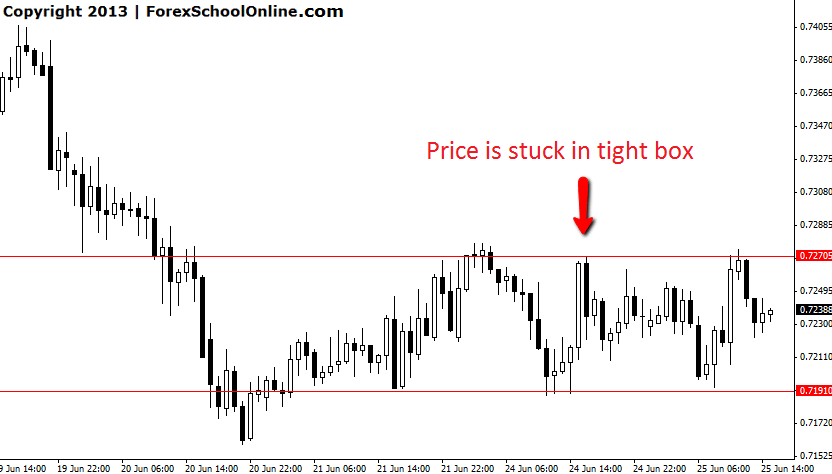
The Daily chart of the NZDCHF shows price in an extended down trend with price down at the extreme low and winding up like a spring. Looking into the price action we can see the 1hr chart shows some interesting price action foot prints.
Price is winding up and is currently stuck in a tight ranging box. This wind up could end with price either breaking out or producing a price action false break out . False breaks can be very high probability trades that can move violently as the market traps and fakes out other traders as their stops are being triggered. The 1hr chart below shows this tight winding up area and traders could look for the the high and low of this box to act as both support and resistance.
NZDCHF 1HR CHART | 25TH JUNE 2013

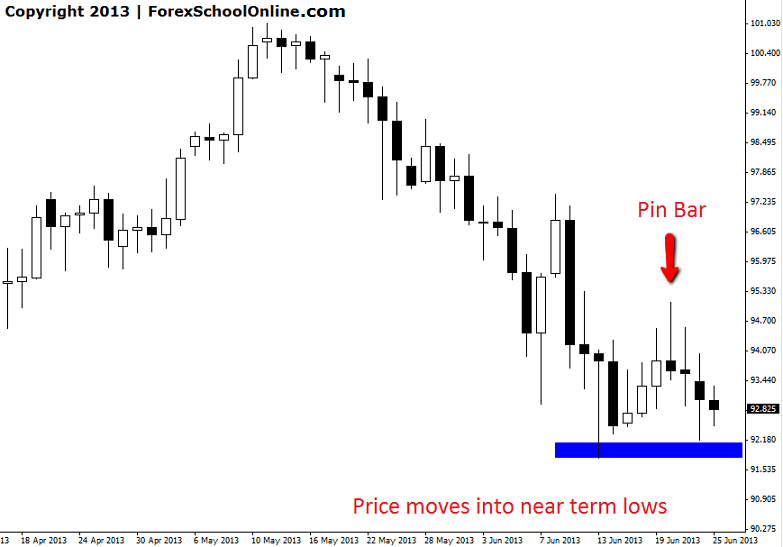
The Pin Bar reversal we posted about in this blog that had formed on the CADJPY has now come off and moved lower into the first near term lows. To read the original post see HERE. Price has now given traders that took this pin that chance to at the minimum protect their capital. If price can continue to move lower the next key support level comes in around 91.25.
CADJPY DAILY CHART | 25TH JUNE 2013


Leave a Reply