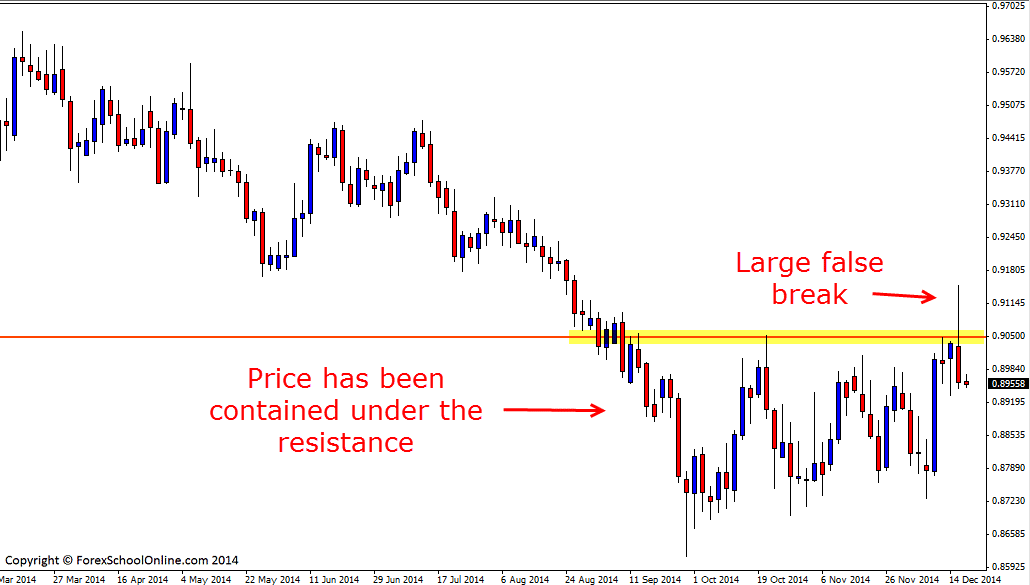
The NZDCAD has fired off a huge false break setup on the 2 day price action chart making a clear false break of the recent tight consolidation area that price has been contained within. Other CAD pairs such as the GBPCAD have also formed rejection false breaks on their 2 day charts rejecting key daily levels. Price on the NZDCAD had tried to breakout higher and through the top of the consolidation area with price making a quick move higher, but this was quickly snapped back lower with the false break being confirmed when price closed back lower and below the key daily resistance level.
As I go through in the trading lesson Reading Order Flow With Price Action the false break is created when price tries to make a break either higher or lower and it gets the market going one way. This quick break gets a lot of the market and breakout traders looking for a breakout and in this scenario these traders were looking for price to breakout of the consolidation and breakout higher. It takes something such as profit taking or sellers to come in and price will then start the quick reversal and begin the false break.
The reason that false breaks will often be so powerful and aggressive is because that a lot of the market has been “faked” in to going one way and now that they are stuck looking for price to breakout higher, they have all of their stops just waiting to be eaten when price moves back lower. As price moves lower it will generally pick up momentum and move faster and faster as it uses the stops of those traders who were looking to make breakout trades as it’s fuel to complete the false break.
Price has now closed back lower and below the key daily resistance level. Price in this pair has been in a sea of chop of late with a lot of sideways traffic areas. When there is a lot of sideways traffic it means price will struggle to make easy movement because every minor support or resistance area could act as a trouble spot. If price can makes it’s way through this traffic and move lower, the first support comes in around the 0.8885 level and then to around the recent box lows at the 0.8780 area. If price does not confirm the false break and attempts another breakout higher, traders would need to see a break and most importantly a close above the breakout area to confirm the breakout just as I go through in the trading lesson; What Secrets Traders Can Learn From Candlesticks and Price Action
Note: To make a different time frame chart with your MT4 platform such as the 2 day chart I have below or to make any time frame you want with your MT4, please read the trading lesson;
Change MT4 Time Frame Indicator EA
NZDCAD 2 Day Chart


Leave a Reply