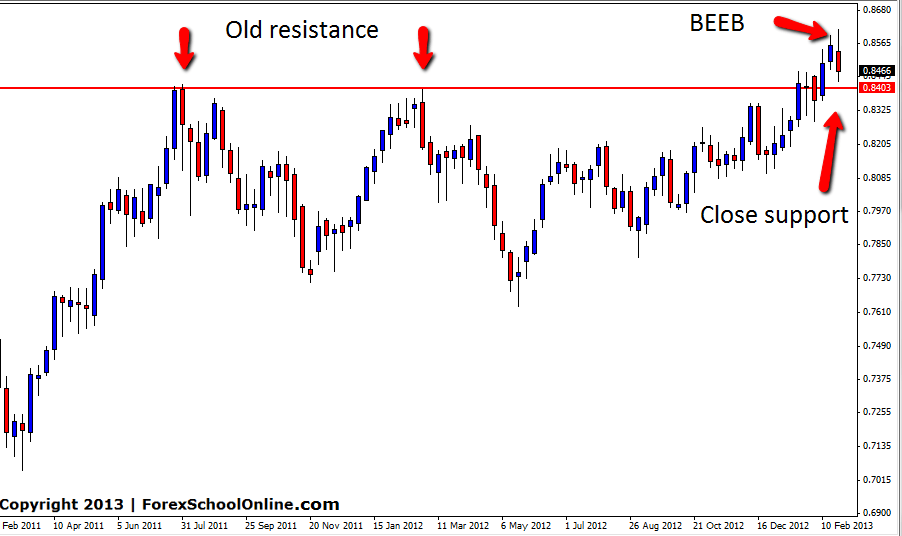
The NZDCAD has formed a Bearish Engulfing Bar (BEEB) on the weekly price action chart. Whilst this BEEB is formed up at a nice swing high, there is a very close near term support level. If price is to make any more solid moves lower it is going to have to make a break out through this support level.
The other scenario for this pair is if this old resistance area holds as new support and bulls come back into the market to take control. One of the most common and reliable patterns in the Forex market is old resistance turning to new support and vice versa. The trend for this pair has been strongly higher of late and to see this support hold before making another move higher could be on the cards.
If price holds at the near term support level and makes a new move higher, the next resistance level comes in around 0.8750. If price does break out through the support and move lower the next near term support comes in around 0.8225.
Traders looking for long trades could look for the near term support area for price action opportunities to get into value trades, where as those looking to get short may be best served waiting to see of the support can break before getting short.
NZDCAD WEEKLY CHART – 3RD MARCH 2013

We have recently released a new article you can read here: If You Want to Win at Forex, You First Have to Learn How to Lose


Leave a Reply